Iowa Car Insurance Guide (Cheap Rates + Best Companies)
Free Car Insurance Comparison
Compare Quotes From Top Companies and Save
Secured with SHA-256 Encryption
Jeffrey Johnson
Insurance Lawyer
Jeffrey Johnson is a legal writer with a focus on personal injury. He has worked on personal injury and sovereign immunity litigation in addition to experience in family, estate, and criminal law. He earned a J.D. from the University of Baltimore and has worked in legal offices and non-profits in Maryland, Texas, and North Carolina. He has also earned an MFA in screenwriting from Chapman Univer...
Insurance Lawyer
UPDATED: Sep 7, 2023
It’s all about you. We want to help you make the right coverage choices.
Advertiser Disclosure: We strive to help you make confident car insurance decisions. Comparison shopping should be easy. We are not affiliated with any one car insurance company and cannot guarantee quotes from any single provider.
Our insurance industry partnerships don’t influence our content. Our opinions are our own. To compare quotes from many different companies please enter your ZIP code on this page to use the free quote tool. The more quotes you compare, the more chances to save.
Editorial Guidelines: We are a free online resource for anyone interested in learning more about car insurance. Our goal is to be an objective, third-party resource for everything car insurance related. We update our site regularly, and all content is reviewed by car insurance experts.
Uninsured Motorists 8.70
Iowa is home to many great small cities with catchy slogans such as Mallard which offers “We’re Friendly Ducks” and Granger, which says “Welcome, stranger, to friendly, Granger.” We’re all for being friendly and every town uses what it has to entice folks from not just flying or driving right on through town.
But perhaps our favorite small-town slogan is from Oakville, which says “This little town is like heaven to us. Don’t drive like hell through it.” We’ll have to take their word for it, but one thing we do know for sure is that when you’re driving through Iowa, you may be paying too much for car insurance.
What if there was a way to help you save on your car insurance? What if it could save you money? Would you take the time? I bet you would and that’s why we’ve compiled this guide to get you started.
And as the folks in Beaman say “You’re not dreamin…You’re in Beaman.” Everything you need to know about buying cheap car insurance in Iowa is in this comprehensive guide.
Enter your zip code below to get started.
How to Get Iowa Car Insurance Coverage and Rates
The median household income in Iowa in 2017 was over $58,570, and drivers, on average paid over $1,058 for car insurance. That’s way too high for us. However, you feel about it, we think consumers in the Hawkeye State are spending way too much money on car insurance.
There has to be a better way.
Compare Quotes From Top Companies and Save
Secured with SHA-256 Encryption
What’s Iowa Minimum Coverage?
State minimum auto insurance rates and minimum insurance requirements vary from state to state. Compare state to state below:
Though car insurance isn’t mandatory in Iowa, if you’re in an accident, according to the Motor Vehicle and Financial Safety Act, you must provide proof of financial responsibility. This proof could be your own liability insurance.
There are also other forms of financial responsibility which can be provided and we’ll cover in another section.
Iowa is an “at-fault” state. What does this mean?
The person who caused, or is at-fault, for an accident must pay any personal injury or property claims.
If you’re insured, your provider will cover losses up to the minimum liability amount. Iowa law requires drivers to have minimum liability coverage.
Liability insurance pays everyone — drivers, passengers, pedestrians, bicyclists, etc. — who are owed money for property damage and/or injuries resulting from a car accident that you or anyone under your policy has caused. Drivers in Iowa must have the following minimum liability insurance if their licenses have been suspended or revoked:
- $20,000 to pay for the injuries of one person
- $40,000 to pay for the injuries of more than one person
- $15,000 to pay for property damage
Remember: these are only the minimum requirements. If the damages cost more, you will need to pay for them. We recommend that you buy more than the minimum liability amount of insurance for greater protection in case of an accident.
What is the Form of Financial Responsibility?
If you live in Iowa, the state law requires you to have a form of financial responsibility. A form of financial responsibility proves that you have valid insurance on your car or are able to pay for costs in an accident. Anytime you are pulled over by an officer or are in an accident, you must provide proof of financial responsibility.
Some acceptable forms of financial responsibility are the following:
- Valid liability insurance ID cards
- Copy of your current car’s insurance policy
- Valid insurance binder (a temporary form of car insurance)
Iowa insurance laws can be confusing because a few loopholes could save you from having to prove financial responsibility at the time of an accident. According to the DMV, below are a few exceptions:
- At the time of the accident, your vehicle was legally standing, stopped, or parked.
- Someone was driving your vehicle without your permission at the time of the accident.
- You were the only person to incur injuries or property damage as a result of the accident.
We know this may be confusing but, just remember you must have proof of financial responsibility on your person when operating a vehicle.
If you do not provide proof of financial responsibility after an accident, you will face fines and suspension of your license and car’s registration unless you provide proof of financial security.
In summary, the easiest way to avoid penalties and navigate tricky laws is to have Iowa’s required car insurance.
What Percentage of Income are Insurance Premiums in Iowa?
The per capita disposable income in Iowa is $39,820. On average, residents spend $684 a year on car insurance. To put this amount in perspective, the countrywide, annual average for car insurance is $981.
This means people in Iowa pay considerably less than the countrywide average and less than neighboring states Illinois and Missouri who pay yearly amounts of $854 and $846, respectively.
Compare Quotes From Top Companies and Save
Secured with SHA-256 Encryption
What are the Average Monthly Car Insurance Rates in IA (Liability, Collision, Comprehensive)?
One of the main concerns of every motorist in Iowa is the rising cost of insurance? The table below shows data provided by the National Association of Insurance Commissioners which is an agency dedicated to keeping up with the changing costs of car insurance.
Coverage Type | Annual Costs (2015) |
---|---|
Liability | $299.18 |
Collision | $275.28 |
Comprehensive | $183.53 |
Combined | $702.46 |
Keep in mind with this information, however, that this data was pulled from 2015. Rates in 2019 will likely be higher than these values.
Up next, we take a look at loss ratios and what they mean to a company’s bottom line.
Is There an Additional Coverage in Iowa?
To gauge the financial health of insurance companies, you should look at its loss ratios. Loss ratios are explained as: the money auto insurance companies pay out in claims compared to the money they take in from premiums.
For example, an auto insurer collects $100,000 of premiums in a given year and pays out $55,000 in claims, the company’s loss ratio is 55 percent ($55,000 incurred losses/$100,000 earned premiums).
Check out the loss ratio for these two types of coverage in Iowa.
Loss Ratio | 2013 | 2014 | 2015 |
---|---|---|---|
Medical Payments (Med Pay) | 67% | 69% | 79% |
Uninsured/Underinsured Motorist | 50% | 68% | 72% |
You may want to consider adding additional coverages or higher levels of coverage to your auto insurance policy, to avoid paying out of pocket in the event of an accident. If you only get the basic liability limits on your policy, medical bills and payments could reach well into the thousands of dollars for those affected by uninsured drivers and force some into financial difficulty.
Are There any Add-ons, Endorsements, and Riders?
No one wants to have a car accident, but if you are, do you have enough protection for you and your family? Have you considered adding optional coverage to your policy? Do you even know what’s out there? Choosing from a list of insurance options can be daunting, and we know you want the best options for your family at the best price.
To help you decide, we’ve made a list of affordable options to add to your policy.
- Guaranteed Auto Protection (GAP)
- Personal Umbrella Policy (PUP)
- Rental Reimbursement
- Emergency Roadside Assistance – If your car breaks down or you have a flat this addition to your policy will help you to pay for the cost of roadside repairs or tow when needed
- Mechanical Breakdown Insurance – Need repairs that were not due to an accident then this type of coverage is for you.
- Non-Owner Car Insurance – This type of coverage is perfect for you if you don’t own a car but still drive on occasion because it provides you with limited liability coverage even if the car you are driving isn’t registered to you.
- Modified Car Insurance Coverage – This type of insurance for drivers covers most modifications made to your vehicle that may not be covered by your general policy should you be involved in an accident.
- Classic Car Insurance – This type of coverage helps ensure a classic, antique or vintage car is protected.
- Usage-Based or Pay-As-You-Drive Insurance
Any of the above coverages would be beneficial to add to your policy, so make sure to discuss any options you are interested in with your insurance provider.
Compare Quotes From Top Companies and Save
Secured with SHA-256 Encryption
What are the Average Monthly Car Insurance Rates by Age & Gender in IA?
Inc.com wrote an article that says women pay more than $100,000 more for the same products as men do. In fact, gender discrimination in car insurance rates is such a problem that California and other states banned gender discrimination and created gender-neutral insurance plans.
https://youtu.be/bZj2y4W-xNg
Up next, we partnered with Quadrant Information Services to show you coverage rates that various folks in Iowa pay for car insurance.
Company | Married 35-year old female annual rate | Married 35-year old male annual rate | Married 60-year old female annual rate | Married 60-year old male annual rate | Single 25-year old female annual rate | Single 25-year old male annual rate | Single 17-year old female annual rate | Single 17-year old male annual rate |
---|---|---|---|---|---|---|---|---|
Allstate F&C | $1,958.15 | $1,879.95 | $1,740.38 | $1,771.40 | $2,131.19 | $2,192.58 | $5,666.77 | $6,380.74 |
American Family Mutual | $1,947.49 | $1,947.49 | $1,742.43 | $1,742.43 | $1,947.49 | $2,345.27 | $5,205.52 | $7,296.86 |
Farmers Insurance Co | $1,505.56 | $1,534.33 | $1,348.08 | $1,472.79 | $2,038.46 | $2,181.07 | $4,551.35 | $4,851.93 |
Geico Cas | $1,871.32 | $1,677.39 | $1,676.90 | $1,535.68 | $1,767.80 | $1,635.28 | $4,252.86 | $3,954.88 |
Safeco Insurance Co America | $2,110.02 | $2,290.23 | $1,856.34 | $2,255.89 | $2,390.92 | $2,636.91 | $10,248.60 | $11,534.94 |
Nationwide Agribusiness Insurance | $1,773.80 | $1,821.30 | $1,580.35 | $1,687.66 | $2,007.84 | $2,184.45 | $4,078.71 | $5,280.35 |
Progressive Northern | $1,685.12 | $1,622.63 | $1,389.61 | $1,441.50 | $2,027.39 | $2,192.49 | $4,131.25 | $4,663.86 |
State Farm Mutual Auto | $1,445.98 | $1,445.98 | $1,270.07 | $1,270.07 | $1,625.39 | $1,851.50 | $3,914.70 | $4,964.07 |
Travelers Home & Marine Ins Co | $2,442.49 | $2,492.53 | $2,373.90 | $2,380.26 | $2,541.28 | $3,002.33 | $10,858.60 | $17,313.68 |
USAA | $1,239.37 | $1,253.71 | $1,136.98 | $1,159.77 | $1,487.70 | $1,643.44 | $3,345.14 | $3,552.75 |
As you can see from the data, teen drivers pay thousands more than older drivers do for car insurance.
Among the major carriers, State Farm and American Family have the exact same rates for most female and male drivers, excluding teenagers. In all instances, male teenage drivers pay more than any other demographic. As with all such information, your rates may be different depending on your location and other circumstances.
Keep in mind, one of the best ways to find cheap auto insurance is to look for companies that offer insurance discounts you are eligible for. Many companies offer bundling discounts if you choose to combine your auto policy with homeowners insurance, renters insurance, or other types of policies. Some also offer discounts to drivers who have anti-theft devices or other safety features on their cars. You might also want to look for an insurance provider that offers Accident Forgiveness or a usage-based insurance program. These programs provide you with an insurance discount for installing a mobile app on your phone or an electronic device in your vehicle that monitors your driving habits. Most of the major auto insurance companies offer a variety of discounts for you to choose from, so there’s no reason you shouldn’t be able to find affordable car insurance.
What are the Highest and Lowest Rates by Zip Code and City?
ZIP codes affect auto insurance because of factors like traffic, crime to name a few. Find out how your ZIP code stacks up in IA.
In addition to gender and age, where you live can affect your car insurance rates. We’ve collected data on the least and most expensive zip codes, so search to see where your zip code lands on the list. You’ll also see providers’ costs next to your zip code, providing a helpful snapshot into what you should be paying.
Here are the 25 ZIP codes in Iowa with the highest average annual car insurance rates.
City | ZIP Code | Average Annual Rate |
---|---|---|
Luther | 51501 | $3,633.75 |
Burlington | 51503 | $3,575.94 |
Sioux Rapids | 51510 | $3,421.91 |
Oxford Junction | 50314 | $3,379.73 |
Indianola | 50309 | $3,367.30 |
Randalia | 51534 | $3,356.47 |
Washington | 51103 | $3,355.94 |
Douds | 50307 | $3,350.71 |
Readlyn | 51105 | $3,350.44 |
Fredericksburg | 51104 | $3,342.31 |
Nichols | 51101 | $3,333.89 |
New Albin | 50308 | $3,327.01 |
Hinton | 51108 | $3,296.59 |
Ames | 52801 | $3,285.41 |
Ricketts | 50319 | $3,262.33 |
Cherokee | 51109 | $3,260.62 |
Muscatine | 51526 | $3,259.16 |
Pilot Mound | 51561 | $3,249.84 |
Webb | 51106 | $3,242.81 |
Ogden | 51654 | $3,239.93 |
Humeston | 50316 | $3,230.43 |
Reinbeck | 51571 | $3,228.18 |
Stanhope | 51533 | $3,223.48 |
Graettinger | 50864 | $3,216.99 |
Hayesville | 51532 | $3,212.72 |
These 25 ZIP codes have the lowest average rates.
City | ZIP Code | Average Annual Rate |
---|---|---|
Corwith | 52241 | $2,598.27 |
Traer | 52242 | $2,605.98 |
South Amana | 52243 | $2,613.15 |
Sioux City | 50012 | $2,643.57 |
Sioux City | 50014 | $2,651.87 |
Sioux City | 50010 | $2,661.70 |
Sioux City | 50011 | $2,663.37 |
Des Moines | 50013 | $2,676.23 |
Carlisle | 50158 | $2,686.15 |
Rose Hill | 52246 | $2,697.81 |
Redfield | 52245 | $2,699.88 |
Blue Grass | 52240 | $2,719.12 |
Clarinda | 50078 | $2,721.11 |
Magnolia | 50236 | $2,725.56 |
Atlantic | 50142 | $2,734.13 |
Ottumwa | 52317 | $2,734.77 |
Joice | 52411 | $2,735.38 |
Bondurant | 50248 | $2,759.69 |
Kellerton | 50122 | $2,762.30 |
Stacyville | 52233 | $2,762.69 |
Des Moines | 50006 | $2,764.17 |
Williamsburg | 52324 | $2,766.77 |
Center Point | 52404 | $2,768.58 |
Tabor | 50126 | $2,769.51 |
Liscomb | 52302 | $2,771.54 |
Iowa City zip codes are among the cheapest places for car insurance, but it’s the most expensive in Council Bluffs. Below, we’ve listed the least and most expensive Iowa cities for car insurance.
Average annual car insurance rates are highest in these 25 cities in Iowa.
City | Average Grand Total |
---|---|
Council Bluffs | $3,604.85 |
Carter Lake | $3,421.91 |
Glenwood | $3,356.47 |
Sioux City | $3,295.84 |
Crescent | $3,259.16 |
Pacific Junction | $3,249.84 |
Thurman | $3,239.93 |
Silver City | $3,228.19 |
Emerson | $3,223.48 |
Des Moines | $3,218.42 |
Villisca | $3,216.99 |
Elliott | $3,212.72 |
Honey Creek | $3,209.76 |
Bedford | $3,204.32 |
Sidney | $3,202.45 |
Henderson | $3,201.16 |
Randolph | $3,197.04 |
Percival | $3,193.43 |
Stanton | $3,192.82 |
Braddyville | $3,185.36 |
Cumberland | $3,180.65 |
Coin | $3,180.34 |
Red Oak | $3,178.98 |
Davenport | $3,178.04 |
Gravity | $3,177.95 |
And these 25 cities have the lowest average annual car insurance rates in the city.
City | Average Grand Total |
---|---|
Coralville | $2,598.27 |
Ames | $2,659.35 |
Iowa City | $2,667.19 |
Marshalltown | $2,686.15 |
Ferguson | $2,721.11 |
Roland | $2,725.56 |
Le Grand | $2,734.13 |
North Liberty | $2,734.77 |
Story City | $2,759.69 |
Hubbard | $2,762.30 |
Hiawatha | $2,762.69 |
Alden | $2,764.18 |
Palo | $2,766.77 |
Iowa Falls | $2,769.51 |
Marion | $2,771.54 |
Tiffin | $2,772.01 |
Radcliffe | $2,772.23 |
Clear Lake | $2,774.04 |
Popejoy | $2,775.99 |
Pella | $2,778.49 |
Mason City | $2,782.99 |
Zearing | $2,785.76 |
Bennett | $2,786.21 |
Eldora | $2,787.19 |
Jewell | $2,787.93 |
Council Bluffs again emerges as the most expensive place to buy car insurance. Though it’s not the largest city in Iowa, it’s one of the state’s 10 largest cities. As this data shows, the population size of a city doesn’t determine insurance costs.
What are the Best Iowa Car Insurance Companies?
From the Iowa Caucuses to the Ottumwa cornfields of M.A.S.H legend Radar O’Reilly, folks in Iowa have a lot to discover and explore. One thing we know for sure is that most of those folks would rather be doing anything else instead of looking and searching for cheaper rates on car insurance.
That’s why we’ve done all of the work for you and researched the best insurance companies in Iowa, so you can make the best choice for your situation. We’ve looked at companies’ financial ratings, AM’s best ratings, and which companies have the most complaints.
Keep reading to learn about Iowa’s auto insurance providers.
Compare Quotes From Top Companies and Save
Secured with SHA-256 Encryption
What is the Financial Rating of the Largest Companies?
Loss ratios play a large part in how secure a company is doing financially. That’s why we want to include AM Best ratings, which look at loss ratios to determine if a company has solid financial security.
So to see how the 10 largest companies in Iowa are doing, we’ve included the AM Best ratings for each.
Company Name | AM Ratings | Direct Premiums Written | Loss Ratio | Market Share |
---|---|---|---|---|
State Farm Group | A++ | $389,032 | 63.96% | 22.14% |
Progressive Group | A+ | $285,107 | 63.34% | 16.23% |
Nationwide Corp Group | A+ | $180,621 | 51.49% | 10.28% |
Iowa Farm Bureau Group | NR | $119,308 | 67.98% | 6.79% |
American Family Insurance Group | A | $111,227 | 69.86% | 6.33% |
Grinnell Mutual Group | A | $78,945 | 71.86% | 4.49% |
Geico | A++ | $64,044 | 78.07% | 3.65% |
IMT Mutual Holding Group | NR | $57,498 | 70.27% | 3.27% |
Allstate Insurance Group | A+ | $56,702 | 60.70% | 3.23% |
West Bend Mutual Insurance Co | A | $38,498 | 58.38% | 2.19% |
Which Companies have the Best Ratings?
Geico ranks near the top of the list — proving that Geico is great at customer satisfaction.
Just because a company has a good rating for financial stability doesn’t mean their customers are always happy.
Let’s check out their record of official complaints.
Company | Complaint Ratio 2017 | Total Complaints 2017 |
---|---|---|
State Farm Group | 0.44 | 1482 |
Progressive Group | 0.75 | 120 |
Nationwide Corp Group | 0.28 | 25 |
Iowa Farm Bureau Group | 2.66 | 3 |
American Family Insurance Group | 0.0 | 0 |
Grinnell Mutual Group | 0.0 | 0 |
Geico | .007 | 6 |
IMT Mutual Holding Group | 2.42 | 1 |
Allstate Insurance Group | 0.98 | 163 |
West Bend Mutual Insurance Co | 0 | 0 |
If a car insurance company’s complaint index is lower than one, they are better than the average. If the index is higher than one, they are worse than the average. Iowa Farm Bureau and IMT Mutual Holding Group have the highest complaint ratios in Iowa.
What are the Cheapest Car Insurance Companies in Iowa?
Nobody likes to be considered cheap, except when it comes to car insurance. In order to save money, you should be shopping around to see what’s available. The table below displays the top carriers in Iowa with their average rate for all drivers and compares it to the state average of all companies.
Company | Average Cost | Amount Compared to State Average | Percentage Compared to State Average |
---|---|---|---|
State Farm Mutual Auto | $2,223.47 | -$734.72 | -33.04% |
Geico Cas | $2,296.51 | -$661.68 | -28.81% |
Progressive Northern | $2,394.23 | -$563.96 | -23.56% |
Farmers Insurance Co | $2,435.45 | -$522.75 | -21.46% |
Nationwide Agribusiness Insurance | $2,551.81 | -$406.39 | -15.93% |
Allstate F&C | $2,965.14 | $6.95 | 0.23% |
American Family Mutual | $3,021.87 | $63.67 | 2.11% |
Safeco Insurance Co America | $4,415.48 | $1,457.29 | 33.00% |
Looking at different providers can save a lot of money. For example, Progressive is $564 BELOW the state average, which, over time, could add up to thousands of dollars saved.
Compare Quotes From Top Companies and Save
Secured with SHA-256 Encryption
What’s the Average Commute Rate?
At some companies, how far you drive to work each day influences your insurance rates. Beyond age, gender, location, marital status, and carrier, other factors that affect your quoted rates from each carrier are those that are specific to your individual situation such as how much coverage you want, credit history, and driving record.
The tables below compare such factors based on each carrier.
Company | Daily Commute | Annual Mileage | Annual Average Rate |
---|---|---|---|
Allstate | 10 miles | 6,000 miles | $2,894.65 |
Allstate | 25 miles | 12,000 miles | $3,035.64 |
American Family | 10 miles | 6,000 miles | $2,986.61 |
American Family | 25 miles | 12,000 miles | $3,057.13 |
Farmers | 10 miles | 6,000 miles | $2,435.45 |
Farmers | 25 miles | 12,000 miles | $2,435.45 |
Geico | 10 miles | 6,000 miles | $2,251.26 |
Geico | 25 miles | 12,000 miles | $2,341.77 |
Liberty Mutual | 10 miles | 6,000 miles | $4,415.48 |
Liberty Mutual | 25 miles | 12,000 miles | $4,415.48 |
Nationwide | 10 miles | 6,000 miles | $2,551.81 |
Nationwide | 25 miles | 12,000 miles | $2,551.81 |
Progressive | 10 miles | 6,000 miles | $2,394.23 |
Progressive | 25 miles | 12,000 miles | $2,394.23 |
State Farm | 10 miles | 6,000 miles | $2,169.94 |
State Farm | 25 miles | 12,000 miles | $2,277.01 |
Travelers | 10 miles | 6,000 miles | $5,425.63 |
Travelers | 25 miles | 12,000 miles | $5,425.63 |
USAA | 10 miles | 6,000 miles | $1,784.77 |
USAA | 25 miles | 12,000 miles | $1,919.94 |
Most company rates don’t change when the drive is shortened to a 10-mile commute, except for Allstate, who offers rate reductions over $125.
Up next, a break-down of coverage level rates in Iowa.
What are the Coverage Levels Rates?
Do you want better coverage, but are reluctant to spend more money? You may be surprised some insurance carriers offer more coverage with minimal increases in rates.
Company | Coverage Level | Annual Average |
---|---|---|
Allstate | High | $3,072.83 |
Allstate | Medium | $2,968.91 |
Allstate | Low | $2,853.70 |
American Family | High | $2,840.53 |
American Family | Medium | $3,189.92 |
American Family | Low | $3,035.16 |
Farmers | High | $2,530.66 |
Farmers | Medium | $2,443.15 |
Farmers | Low | $2,332.54 |
Geico | High | $2,411.84 |
Geico | Medium | $2,297.14 |
Geico | Low | $2,180.55 |
Liberty Mutual | High | $4,601.36 |
Liberty Mutual | Medium | $4,407.47 |
Liberty Mutual | Low | $4,237.62 |
Nationwide | High | $2,455.20 |
Nationwide | Medium | $2,539.43 |
Nationwide | Low | $2,660.79 |
Progressive | High | $2,521.62 |
Progressive | Medium | $2,402.19 |
Progressive | Low | $2,258.89 |
State Farm | High | $2,318.68 |
State Farm | Medium | $2,236.04 |
State Farm | Low | $2,115.69 |
Travelers | High | $5,666.01 |
Travelers | Medium | $5,507.84 |
Travelers | Low | $5,103.05 |
USAA | High | $1,941.61 |
USAA | Medium | $1,858.31 |
USAA | Low | $1,757.16 |
For example, the data above shows Nationwide and Liberty Mutual have less than $400 increases from low to high coverage.
What are the Credit History Rates by Companies?
The quality of your credit score impacts your insurance rates. In Iowa, the average credit score is 695, which is above the nationwide average of 675. Basically, this means motorists may be able to pay less for their coverage based on their credit history.
The table below shows what you can expect to pay yearly on car insurance based on your credit history.
Company | Credit History | Annual Average |
---|---|---|
Allstate | Poor | $3,544.28 |
Allstate | Fair | $2,817.56 |
Allstate | Good | $2,533.59 |
American Family | Poor | $3,853.23 |
American Family | Fair | $2,831.65 |
American Family | Good | $2,380.74 |
Farmers | Poor | $2,793.56 |
Farmers | Fair | $2,317.58 |
Farmers | Good | $2,195.20 |
Geico | Poor | $2,759.89 |
Geico | Fair | $2,296.52 |
Geico | Good | $1,833.13 |
Liberty Mutual | Poor | $6,295.97 |
Liberty Mutual | Fair | $3,889.40 |
Liberty Mutual | Good | $3,061.08 |
Nationwide | Poor | $3,100.67 |
Nationwide | Fair | $2,427.31 |
Nationwide | Good | $2,127.45 |
Progressive | Poor | $2,828.78 |
Progressive | Fair | $2,284.84 |
Progressive | Good | $2,069.08 |
State Farm | Poor | $3,166.55 |
State Farm | Fair | $1,958.88 |
State Farm | Good | $1,544.99 |
Travelers | Poor | $6,101.70 |
Travelers | Fair | $5,210.35 |
Travelers | Good | $4,964.86 |
USAA | Poor | $2,434.97 |
USAA | Fair | $1,673.05 |
USAA | Good | $1,449.06 |
If you have insurance through Liberty Mutual and have poor credit, you can expect to pay $3000 more for car insurance than someone with good credit.
Compare Quotes From Top Companies and Save
Secured with SHA-256 Encryption
What are the Driving Record Rates?
A clean driving record is the EASIEST way to keep rates down. As you can see from the information below, at Liberty Mutual, just one speeding violation can raise your rate by over $500.
Company | Record | Average Annual Cost |
---|---|---|
Allstate | Clean record | $2,520.15 |
Allstate | With 1 speeding violation | $2,818.27 |
Allstate | With 1 accident | $3,051.76 |
Allstate | With 1 DUI | $3,470.40 |
American Family | Clean record | $2,181.69 |
American Family | With 1 speeding violation | $2,564.80 |
American Family | With 1 accident | $3,194.70 |
American Family | With 1 DUI | $4,146.29 |
Farmers | Clean record | $2,075.02 |
Farmers | With 1 speeding violation | $2,479.99 |
Farmers | With 1 accident | $2,574.18 |
Farmers | With 1 DUI | $2,612.59 |
Geico | Clean record | $1,739.14 |
Geico | With 1 speeding violation | $1,865.34 |
Geico | With 1 accident | $2,430.59 |
Geico | With 1 DUI | $3,150.98 |
Liberty Mutual | Clean record | $3,813.55 |
Liberty Mutual | With 1 speeding violation | $4,318.32 |
Liberty Mutual | With 1 accident | $4,718.68 |
Liberty Mutual | With 1 DUI | $4,811.37 |
Nationwide | Clean record | $1,845.32 |
Nationwide | With 1 speeding violation | $2,088.61 |
Nationwide | With 1 accident | $2,653.56 |
Nationwide | With 1 DUI | $3,619.74 |
Progressive | Clean record | $1,925.00 |
Progressive | With 1 speeding violation | $2,409.88 |
Progressive | With 1 accident | $3,153.79 |
Progressive | With 1 DUI | $2,088.27 |
State Farm | Clean record | $2,058.27 |
State Farm | With 1 speeding violation | $2,223.47 |
State Farm | With 1 accident | $2,388.67 |
State Farm | With 1 DUI | $2,223.47 |
Travelers | Clean record | $3,954.60 |
Travelers | With 1 speeding violation | $5,414.68 |
Travelers | With 1 accident | $5,272.67 |
Travelers | With 1 DUI | $7,060.59 |
USAA | Clean record | $1,414.93 |
USAA | With 1 speeding violation | $1,624.60 |
USAA | With 1 accident | $1,899.66 |
USAA | With 1 DUI | $2,470.24 |
A better record equals better rates. We encourage you to obey posted speed limit signs and NOT drink and drive.
What are the Largest Car Insurance Companies in Iowa?
Company | DIRECT PREMIUMS WRITTEN | LOSS RATIO | MARKET SHARE |
---|---|---|---|
State Farm Group | $38,9032 | 63.96% | 22.14% |
Progressive Group | $285,107 | 63.34% | 16.23% |
Nationwide Corp Group | $180,621 | 51.49% | 10.28% |
Iowa Farm Bureau Group | $119,308 | 67.98% | 6.79% |
American Family Insurance Group | $111,227 | 69.86% | 6.33% |
Grinnell Mutual Group | $78,945 | 71.86% | 4.49% |
Geico | $64044 | 78.07% | 3.65% |
IMT Mutual Holding Group | $57,498 | 70.27% | 3.27% |
Allstate Insurance Group | $56702 | 60.70% | 3.23% |
West Bend Mutual Insurance Co | $38,498 | 58.38% | 2.19% |
What’s the Number of Property and Casualty Insurance Companies in Iowa?
Domestic insurance means a company is formed under Iowa’s state laws, whereas a foreign provider is formed under the laws of any other state in the country.
- Domestic Insurers: 73
- Foreign Insurers: 860
Comparing quotes will help you know where to get started. Once you find the company that offers the best rates to you, do some more research into their financial rating, customer satisfaction rating, and complaint ratios. Then, you can confidently choose your insurer.
Compare Quotes From Top Companies and Save
Secured with SHA-256 Encryption
What are the Iowa State Laws?
In Iowa, you’d be better off playing a one-armed bandit at Prarie Meadows Casino than offering to pay a one-armed piano player to perform their favorite tune.
As crazy as it may seem, in Iowa, a one-armed piano player must perform for free. And for you fellows sporting a mustache, don’t even try and kiss your girlfriend in public, because that’s against the law, too.
We know, state laws are odd and sometimes confusing and vary from state to state. New residents may receive tickets for laws they didn’t know existed.
Next, we help you uncover what the laws are, so check out our roundup of Iowa’s driving laws.
What are the Iowa’s Car Insurance Laws?
Insurance companies are subject to certain rules and regulations.
Let’s look at some of the specific laws for consumers regarding car insurance.
How to Get Windshield Coverage
Iowa law doesn’t require insurers to replace cracked or broken windshields. If you want windshield coverage, you will need comprehensive insurance and you will have to examine carefully how the different insurance providers handle windshield claims. Basically, if you have comprehensive coverage, your insurer will likely pay for the repairs.
Compare Quotes From Top Companies and Save
Secured with SHA-256 Encryption
How to Get High-Risk Insurance
If you have a bad driving record, it may be difficult to find an insurance company that is willing to insure you as a driver. Luckily, in most states, insurance companies have made programs available to provide affordable coverage for those who are high-risk drivers.
High-risk insurance is likely the last thing you want to purchase. Sometimes, though, accidents happen and the law will require you to have high-risk insurance. If you are required to have high-risk insurance, you must fill out an SR-22 form.
An SR-22 form requires you to have the MINIMUM amounts of liability insurance in Iowa. Iowa laws are confusing.
One thing to remember: drivers aren’t necessarily required to have minimum car insurance — just proof of financial responsibility if they are in an accident.
Is There an Automobile Insurance Fraud in Iowa?
What is automobile insurance fraud?
- Creating a claim for damages or injuries that NEVER occurred (such as faking an accident)
- Adding “extra” costs onto a claim that is legitimate
- failing to be completely truthful when completing your application(s) – also known as application fraud or rate avoidance
What’s the Statute of Limitations?
If you are in a car accident in Iowa, there is a statute of limitations if you want to file a claim.
- Property Damage Liability Coverage – Two Years
- Bodily Injury Liability Coverage– Five Years
Compare Quotes From Top Companies and Save
Secured with SHA-256 Encryption
What does Iowa’s Clean Claim Law mean?
In Iowa, the law requires insurers to respond to claims that their customers submit. Insurers that don’t respond to claims can be legally pursued. It is important to note that while the law requires insurers to respond to claims, insurers may “conveniently” forget benefits that you are privy to.
Make sure you know what’s covered in your policy in case of an accident. You want ALL of the benefits you’ve been paying for and are entitled to receive.
What are Iowa’s Vehicle Licensing Laws?
Iowa, just like every other state, has mandatory licensing laws in addition to the statute of limitations and car insurance laws, which we previously covered.
Up next, we delve further into the state’s licensing requirements for teen drivers, older drivers, the general population and much more.
Is REAL ID Required in Iowa?
Iowa is in full compliance with the REAL ID Act passed by Congress and enforced by Homeland Security. This means that a driver’s license or state ID issued by the Hawkeye State is an acceptable form of identification at federal facilities, airports, and nuclear power plants.
As of October 1, 2020, anyone wishing to fly on a commercial flight or enter a federal facility must have a REAL ID-compliant form of identification.
Compare Quotes From Top Companies and Save
Secured with SHA-256 Encryption
What are the Teen Driver Laws?
To begin driving in Iowa, teens must be 14 to apply for a learner’s license. Before teens can apply for a regular license or a restricted license, the Insurance Institute for Highway Safety (IIHS) specifies that teens must meet the requirements below.
Requirements for Getting a License or Restricted License in Iowa | Time Limits |
---|---|
Mandatory holding period | 12 months |
Minimum supervised driving time | 20 hours (2 of which must be at night) |
Minimum age | 16-years-old |
During the intermediate or restricted license state, there are certain rules teen drivers must follow.
Intermediate License Restrictions in Iowa | Details | Removal Time Limit |
---|---|---|
Nighttime restrictions | 12:30 a.m. to 5 a.m. | May be lifted after 12 months and age 17 or until age 18 (whichever occurs first) |
Passenger Restrictions (family members excepted) | At parental discretion | May be changed at parental discretion |
What are the License Renewal Procedures for Older Drivers?
Iowa law requires drivers over 72 years old to renew their licenses every two years. Below are a few more rules:
- Proof of adequate vision is required at every renewal
- Online or mail renewal is not allowed for drivers age 70 and older
If you are an older driver, be prepared to visit your eye doctor and the DMV every two years.
What is the Procedure for New Residents?
Considering a move to the Hawkeye State? Here are the guidelines for getting a new Iowa driver’s license. If you want to drive in Iowa, you need car insurance or proof of financial responsibility.
You can opt out of uninsured motorist coverage, but you should have bodily injury liability coverage and property damage liability insurance. As a reminder, these are the minimum amounts in Iowa:
- $20,000 to pay for the injuries of one person
- $40,000 to pay for the injuries of more than one person
- $15,000 to pay for property damage
Though car insurance isn’t legally required in Iowa, you could face penalties for driving without it. So, when you move to Iowa, make sure that you have adequate coverage.
Compare Quotes From Top Companies and Save
Secured with SHA-256 Encryption
What are the License Renewal Procedures?
The license renewal procedures for the general population are as follows:
- Residents under age 70 must renew their licenses every eight years.
- Iowa drivers under 70 years old can renew their licenses by mail or online at every other renewal.
- Proof of adequate vision is also required when renewing in person
What is Considered Reckless Driving?
Reckless or negligent driving is against the law in Iowa. Reckless or careless driving is when a person’s driving endangers other people and property. Usually, reckless driving is classified as a misdemeanor.
Possible penalties for reckless driving:
- 30 days in jail and/or fines that range from $25 to $625
- 5-30 day license suspension
For more serious cases of reckless driving, in which a driver causes the death of another person through reckless driving, the penalties are much more severe.
What are Iowa’s Rules of the Road?
We all should obey the rules, but if you’re new to the state, there may be laws you’re unfamiliar with. That’s why we’ve assembled a list of several important laws to help keep you in good standing and on the road.
Compare Quotes From Top Companies and Save
Secured with SHA-256 Encryption
Is Iowa at Fault or No-Fault State?
Iowa is a fault-based state which means if you are the cause of a car accident, you are responsible for any damage caused. The at-fault driver ‘s insurance company will handle such losses up to and until the policy limits are exhausted.
What are the Seat Belt and Car Seat Laws?
All passengers in the front seat of a vehicle driven in Iowa must be wearing a seat belt. Additionally, children, ages 6-17 years are allowed to use an adult safety belt. Also, children younger than one year and less than 20 pounds must be in a rear-facing child restraint, and kids, 1-5 years should be in a child restraint or a booster seat.
Iowa doesn’t currently have any legislation restricting passengers from riding in the cargo seat areas of pick up trucks.
What are the Keep Right and Move Over Laws?
Iowa traffic laws mandate that you must keep right when traveling slower than the average speed of traffic around you. Generally, the left lane is for faster traffic and passing.
Move over laws are enacted to keep traffic moving and all motorists safe.
Compare Quotes From Top Companies and Save
Secured with SHA-256 Encryption
What’s the Maximum Speed Limit?
Maximum posted speed limits are 70 mph on rural interstates, 55 mph on urban interstates, 75 mph on limited access roads and 65 mph on all other roads.
How does Ridesharing Work?
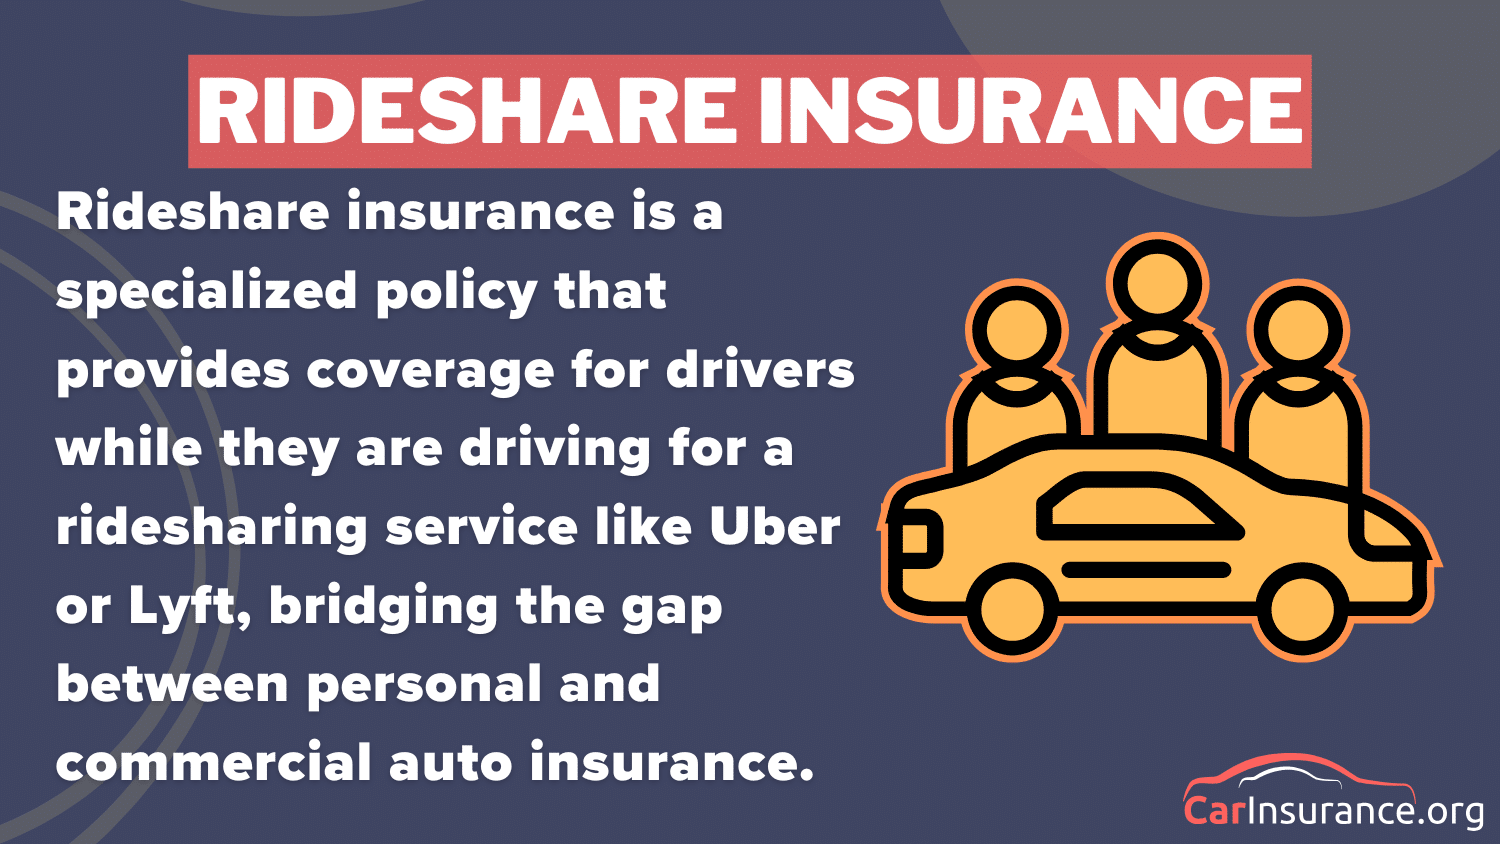
Rideshare services like Uber and Lyft mandate that all their drivers carry personal car insurance that meets the minimum requirements. However, if drivers wish to purchase a commercial insurance policy, these are the companies that provide auto insurance coverage.
- Farmers
- State Farm
- USAA
Is There an Automation on the Road?
According to the Insurance Institute for Highway Safety (IIHS),
“Automation is the use of a machine or technology to perform a task or function that was previously carried out by a human. In driving, automation involves using radar, camera and other sensors to gather information about a vehicle’s surroundings, which is then used by computer programs to perform parts or all of the driving task on a sustained basis.”
Currently, Iowa has no restrictions on autonomous vehicles.
Compare Quotes From Top Companies and Save
Secured with SHA-256 Encryption
What are the Safety Laws?
Up next, we look closer at the safety laws in Iowa, so you can arrive alive. Please don’t drink and drive.
What are the DUI Laws?
Driving under the influence has disastrous results for everyone involved, that’s why strict laws are in place to prevent such tragedies. In Iowa alone, drunk driving caused 88 deaths in 2017. Each state differs in how they address drunk driving and therefore have different penalties.
Below, we’ve listed the details about Iowa’s impaired driving laws.
Impaired Driving Law in Iowa | Details |
---|---|
Name for Offense | Operating While Intoxicated (OWI) |
BAC Limit | 0.08 |
High BAC Categories | 0.15 |
Criminal Status | - 1st serious misdemeanor - 2nd aggravated misdemeanor - 3rd+ class D felony |
Look Back Period | 12 years |
For each offense, the penalties grow steadily worse.
Number of Offense | License Suspension or Revocation and IID lock | IID Lock | Imprisonment | Fine | Other |
---|---|---|---|---|---|
1st Offense | 180 days (may apply for temporary restricted license) | Must install IID if crash occurred or BAC > .10 | 48 hours up to 1 year; min 48 hours may be served in OWI program with law enforcement security | $625 up to $1,250 OR community service | - Complete substance abuse evaluation and treatment program - Might be assigned a reality education substance abuse prevention program |
2nd Offense | 2 years (not eligible for temporary restricted license for 45 days) | not specified | 7 days to 2 years | $1,875 to $6,250 | Same as 1st offense |
3rd Offense | 6 years (not eligible for temporary restricted license for 45 days) | not specified | 30 days to 5 years | $3,125 to $9,375 | Same as 1st offense |
4th Offense | Same as 3rd offense | Same as 3rd offense | Same as 3rd offense | Same as 3rd offense | Same as 1st offense |
Arrive alive. Please don’t drink and drive.
What are the Marijuana-Impaired Driving Laws?
Got grass? If so, don’t smoke it in Iowa.
Iowa is among the few states with zero tolerance for marijuana-impaired driving.
On top of that, marijuana, like other substances, can remain in your urine for up to a month, and be detected in hair samples for several months. If officers suspect marijuana use, they can still charge you for driving under the influence even if you used it in a state where recreational weed is legal.
Compare Quotes From Top Companies and Save
Secured with SHA-256 Encryption
What are the Distracted Driving Laws?
Text messaging while driving is prohibited for all drivers. Additionally, drivers issued a restricted license (age 16-18), instruction permit, or intermediate drivers license may not use an electronic communication device or an electronic entertainment device while driving.
What’s Driving In Iowa like?
Now that you have a good understanding of Iowa state laws, let’s dive into some facts that you might not know. While insurance is important, it’s also crucial to know what to keep your eyes out for on the road.
Is There a Vehicle Theft in Iowa?
Believe it or not, over 4,1001 vehicle thefts occurred in 2016 alone in Iowa. When considering your next car purchase, one thing to consider is that certain vehicles are stolen more frequently, and thus, may have higher insurance rates.
Here’s a list of the top stolen vehicles in Iowa.
Vehicle Make and Model | Vehicle Year | Total Stolen |
---|---|---|
Chevrolet Pickup (Full Size) | 2002 | 258 |
Ford Pickup (Full Size) | 2001 | 198 |
Chevrolet Impala | 2005 | 101 |
Dodge Pickup (Full Size) | 2004 | 93 |
Ford Taurus | 2003 | 77 |
Jeep Cherokee/Grand Cherokee | 2005 | 65 |
GMC Pickup (Full Size) | 2007 | 60 |
Toyota Camry | 1997 | 59 |
Dodge Caravan | 2005 | 56 |
Pontiac Grand Prix | 1999 | 56 |
The full-size Chevrolet pickup is the most stolen vehicle in the state.
Compare Quotes From Top Companies and Save
Secured with SHA-256 Encryption
What’s the Number of Vehicle Theft by City?
Where you live also plays a role in the number of vehicle thefts. The FBI created a 2016 report on Iowa’s vehicle thefts by cities, which are listed below.
City | Number of Vehicle Thefts |
---|---|
Adel | 2 |
Albia | 5 |
Algona | 1 |
Altoona | 14 |
Ames | 34 |
Anamosa | 2 |
Ankeny | 36 |
Bettendorf | 12 |
Bloomfield | 6 |
Blue Grass | 0 |
Boone | 15 |
Buffalo | 2 |
Camanche | 0 |
Carlisle | 3 |
Carroll | 11 |
Carter Lake | 25 |
Cedar Falls | 24 |
Cedar Rapids | 297 |
Centerville | 13 |
Chariton | 5 |
Charles City | 3 |
Cherokee | 2 |
Clarinda | 11 |
Clear Lake | 8 |
Clinton | 45 |
Clive | 18 |
Coralville | 11 |
Council Bluffs | 541 |
Cresco | 0 |
Davenport | 239 |
Decorah | 3 |
Denison | 10 |
Des Moines | 850 |
De Witt | 3 |
Dubuque | 60 |
Dyersville | 3 |
Eagle Grove | 3 |
Eldora | 2 |
Eldridge | 4 |
Emmetsburg | 1 |
Estherville | 4 |
Evansdale | 2 |
Fairfield | 9 |
Forest City | 4 |
Fort Dodge | 84 |
Fort Madison | 12 |
Glenwood | 13 |
Grinnell | 6 |
Grundy Center | 0 |
Hampton | 0 |
Hawarden | 1 |
Hiawatha | 7 |
Humboldt | 10 |
Indianola | 19 |
Iowa City | 82 |
Iowa Falls | 1 |
Jefferson | 0 |
Johnston | 9 |
Keokuk | 27 |
Le Claire | 1 |
Le Mars | 10 |
Leon | 1 |
Lisbon | 0 |
Manchester | 4 |
Maquoketa | 6 |
Marengo | 0 |
Marion | 17 |
Marshalltown | 37 |
Mason City | 30 |
Monticello | 2 |
Mount Vernon | 1 |
Muscatine | 23 |
New Hampton | 0 |
Newton | 18 |
North Liberty | 11 |
Norwalk | 1 |
Oelwein | 6 |
Orange City | 3 |
Osage | 1 |
Osceola | 14 |
Oskaloosa | 8 |
Ottumwa | 69 |
Pella | 2 |
Perry | 8 |
Pleasant Hill | 8 |
Prairie City | 1 |
Red Oak | 6 |
Sergeant Bluff | 1 |
Sheldon | 4 |
Shenandoah | 9 |
Sioux City | 240 |
Spencer | 4 |
Spirit Lake | 5 |
State Center | 1 |
Storm Lake | 11 |
Story City | 0 |
Toledo | 2 |
Urbandale | 25 |
Vinton | 3 |
Walcott | 0 |
Washington | 7 |
Waukee | 1 |
Waukon | 0 |
Waverly | 8 |
Webster City | 12 |
West Burlington | 8 |
West Des Moines | 76 |
West Liberty | 1 |
Williamsburg | 0 |
Wilton | 1 |
Windsor Heights | 6 |
Winterset | 2 |
Des Moines leads the way with 850 vehicle thefts in 2016. Be sure to lock your vehicle whenever you aren’t driving it.
What’s the Number of Road Fatalities in Iowa?
Accidents can and do happen, and next, we’re going to show you statistics for different kinds of accidents in Iowa.
What’s the Number of Fatal Crashes by Weather Condition and Light Condition?
Weather Condition | Daylight | Dark, but Lighted | Dark | Dawn or Dusk | Other / Unknown | Total |
---|---|---|---|---|---|---|
Normal | 146 | 21 | 85 | 14 | 1 | 267 |
Rain | 4 | 3 | 4 | 0 | 0 | 11 |
Snow/Sleet | 4 | 0 | 3 | 0 | 0 | 7 |
Other | 3 | 2 | 3 | 1 | 0 | 9 |
Unknown | 3 | 0 | 3 | 0 | 1 | 7 |
TOTAL | 160 | 26 | 98 | 15 | 2 | 301 |
As you can see, most accidents occur during daylight hours.
Compare Quotes From Top Companies and Save
Secured with SHA-256 Encryption
What’s the Number of Fatalities (All Crashes) by County?
Here are the Iowa counties with the most fatalities over the past five years.
County | 2013 | 2014 | 2015 | 2016 | 2017 |
---|---|---|---|---|---|
Polk County | 26 | 19 | 20 | 28 | 27 |
Linn County | 12 | 14 | 5 | 20 | 16 |
Cerro Gordo County | 3 | 6 | 7 | 6 | 12 |
Marshall County | 3 | 5 | 4 | 4 | 12 |
Pottawattamie County | 9 | 16 | 13 | 13 | 12 |
Dubuque County | 4 | 9 | 4 | 4 | 10 |
Iowa County | 2 | 1 | 5 | 8 | 9 |
Black Hawk County | 12 | 5 | 10 | 11 | 8 |
Johnson County | 7 | 8 | 5 | 16 | 8 |
Scott County | 11 | 13 | 21 | 19 | 8 |
Top Ten Counties Total | 113 | 111 | 124 | 151 | 122 |
All Other Counties Total | 203 | 209 | 196 | 251 | 208 |
Overall Total | 316 | 320 | 320 | 402 | 330 |
What’s the Number of Fatalities by Roadway?
Next, we have a 10-year comparison of traffic fatalities on urban vs. rural roadways.
Road Type | 2003-2005 | 2004-2006 | 2005-2007 | 2006-2008 | 2007-2009 |
---|---|---|---|---|---|
Rural | 345 | 348 | 364 | 347 | 335 |
Urban | 82 | 78 | 81 | 86 | 75 |
Total | 427 | 426 | 445 | 432 | 410 |
Rural roads in Iowa see far more fatalities than urban roads.
Next, we’ll look at the different individuals that contribute to fatal crashes, such as vehicle type and pedestrian/occupants.
What’s the Number of Fatalities by Person Type?
Person Type | 2013 | 2014 | 2015 | 2016 | 2017 |
---|---|---|---|---|---|
Passenger Car | 130 | 117 | 111 | 152 | 109 |
Light Truck - Pickup | 38 | 53 | 71 | 53 | 54 |
Light Truck - Utility | 43 | 32 | 42 | 54 | 42 |
Light Truck - Van | 26 | 17 | 12 | 32 | 17 |
Light Truck - Other | 0 | 1 | 0 | 0 | 0 |
Large Truck | 10 | 11 | 6 | 11 | 18 |
Bus | 0 | 0 | 0 | 0 | 2 |
Other/Unknown Occupants | 6 | 15 | 4 | 8 | 10 |
Total Motorcyclists | 41 | 52 | 41 | 60 | 48 |
Pedestrian | 20 | 19 | 25 | 22 | 23 |
Bicyclist and Other Cyclists | 3 | 4 | 5 | 8 | 5 |
Other/Unknown Non-occupants | 0 | 1 | 3 | 2 | 2 |
Total | 317 | 322 | 320 | 402 | 330 |
Compare Quotes From Top Companies and Save
Secured with SHA-256 Encryption
What’s the Number of Fatalities by Crash Type?
Crash Type | 2013 | 2014 | 2015 | 2016 | 2017 |
---|---|---|---|---|---|
- (1) Single Vehicle | 169 | 167 | 168 | 203 | 182 |
- (2) Involving a Large Truck | 61 | 48 | 61 | 70 | 67 |
- (3) Involving Speeding | 51 | 45 | 49 | 94 | 70 |
- (4) Involving a Rollover | 109 | 110 | 115 | 110 | 124 |
- (5) Involving a Roadway Departure | 185 | 208 | 185 | 231 | 207 |
- (6) Involving an Intersection (or Intersection Related) | 78 | 85 | 102 | 113 | 85 |
Total Fatalities (All Crashes) | 317 | 322 | 320 | 402 | 330 |
Five-Year Trend for the Top 10 Counties
County | 2013 | 2014 | 2015 | 2016 | 2017 |
---|---|---|---|---|---|
Polk County | 26 | 19 | 20 | 28 | 27 |
Linn County | 12 | 14 | 5 | 20 | 16 |
Cerro Gordo County | 3 | 6 | 7 | 6 | 12 |
Marshall County | 3 | 5 | 4 | 4 | 12 |
Pottawattamie County | 9 | 16 | 13 | 13 | 12 |
Dubuque County | 4 | 9 | 4 | 4 | 10 |
Iowa County | 2 | 1 | 5 | 8 | 9 |
Black Hawk County | 12 | 5 | 10 | 11 | 8 |
Johnson County | 7 | 8 | 5 | 16 | 8 |
Scott County | 11 | 13 | 21 | 19 | 8 |
Top Ten Counties Total | 113 | 111 | 124 | 151 | 122 |
All Other Counties Total | 203 | 209 | 196 | 251 | 208 |
Overall Total | 316 | 320 | 320 | 402 | 330 |
What’s the Number of Fatalities Involving Speeding by County?
County Name | 2013 | 2014 | 2015 | 2016 | 2017 |
---|---|---|---|---|---|
Adair County | 0 | 0 | 0 | 0 | 0 |
Adams County | 0 | 0 | 0 | 0 | 0 |
Allamakee County | 2 | 1 | 0 | 1 | 0 |
Appanoose County | 1 | 0 | 2 | 3 | 0 |
Audubon County | 0 | 0 | 0 | 0 | 1 |
Benton County | 1 | 0 | 0 | 4 | 0 |
Black Hawk County | 1 | 1 | 3 | 4 | 1 |
Boone County | 0 | 2 | 0 | 2 | 0 |
Bremer County | 0 | 0 | 0 | 0 | 0 |
Buchanan County | 0 | 0 | 0 | 1 | 0 |
Buena Vista County | 0 | 0 | 0 | 0 | 0 |
Butler County | 0 | 0 | 1 | 0 | 0 |
Calhoun County | 0 | 0 | 0 | 0 | 1 |
Carroll County | 0 | 2 | 0 | 0 | 0 |
Cass County | 0 | 1 | 0 | 6 | 1 |
Cedar County | 0 | 0 | 1 | 1 | 1 |
Cerro Gordo County | 1 | 0 | 1 | 0 | 9 |
Cherokee County | 0 | 0 | 0 | 1 | 0 |
Chickasaw County | 0 | 1 | 0 | 0 | 0 |
Clarke County | 1 | 0 | 0 | 1 | 0 |
Clay County | 1 | 2 | 0 | 0 | 0 |
Clayton County | 0 | 0 | 0 | 1 | 0 |
Clinton County | 0 | 0 | 1 | 0 | 0 |
Crawford County | 0 | 0 | 1 | 2 | 0 |
Dallas County | 2 | 0 | 0 | 4 | 0 |
Davis County | 0 | 0 | 1 | 1 | 0 |
Decatur County | 0 | 0 | 0 | 0 | 1 |
Delaware County | 0 | 0 | 0 | 0 | 0 |
Des Moines County | 0 | 1 | 0 | 0 | 0 |
Dickinson County | 2 | 0 | 0 | 0 | 1 |
Dubuque County | 0 | 1 | 1 | 2 | 3 |
Emmet County | 0 | 0 | 0 | 0 | 0 |
Fayette County | 0 | 5 | 0 | 1 | 2 |
Floyd County | 1 | 0 | 0 | 0 | 0 |
Franklin County | 0 | 0 | 0 | 0 | 0 |
Fremont County | 0 | 0 | 0 | 0 | 2 |
Greene County | 0 | 0 | 0 | 0 | 0 |
Grundy County | 0 | 0 | 0 | 0 | 0 |
Guthrie County | 0 | 1 | 0 | 0 | 0 |
Hamilton County | 0 | 0 | 0 | 1 | 0 |
Hancock County | 0 | 0 | 0 | 0 | 0 |
Hardin County | 0 | 1 | 0 | 0 | 0 |
Harrison County | 1 | 0 | 0 | 0 | 0 |
Henry County | 0 | 0 | 1 | 1 | 0 |
Howard County | 1 | 0 | 0 | 0 | 0 |
Humboldt County | 0 | 0 | 0 | 0 | 0 |
Ida County | 0 | 0 | 0 | 0 | 0 |
Iowa County | 0 | 0 | 0 | 3 | 5 |
Jackson County | 0 | 0 | 0 | 0 | 1 |
Jasper County | 2 | 2 | 1 | 1 | 2 |
Jefferson County | 0 | 0 | 0 | 0 | 0 |
Johnson County | 1 | 0 | 0 | 1 | 3 |
Jones County | 0 | 0 | 0 | 0 | 0 |
Keokuk County | 1 | 0 | 0 | 0 | 0 |
Kossuth County | 0 | 0 | 1 | 0 | 0 |
Lee County | 0 | 1 | 1 | 2 | 1 |
Linn County | 2 | 2 | 1 | 7 | 5 |
Louisa County | 0 | 0 | 1 | 0 | 0 |
Lucas County | 0 | 0 | 0 | 0 | 0 |
Lyon County | 0 | 0 | 0 | 0 | 0 |
Madison County | 0 | 2 | 0 | 1 | 1 |
Mahaska County | 1 | 0 | 0 | 1 | 1 |
Marion County | 0 | 0 | 1 | 1 | 1 |
Marshall County | 0 | 3 | 0 | 0 | 0 |
Mills County | 0 | 1 | 0 | 0 | 1 |
Mitchell County | 0 | 0 | 0 | 0 | 0 |
Monona County | 0 | 1 | 0 | 1 | 2 |
Monroe County | 0 | 0 | 0 | 0 | 0 |
Montgomery County | 0 | 0 | 0 | 0 | 0 |
Muscatine County | 0 | 0 | 0 | 0 | 1 |
O Brien County | 0 | 0 | 0 | 0 | 0 |
Osceola County | 0 | 0 | 0 | 0 | 1 |
Page County | 1 | 0 | 0 | 0 | 0 |
Palo Alto County | 0 | 0 | 0 | 0 | 0 |
Plymouth County | 0 | 0 | 0 | 0 | 2 |
Pocahontas County | 0 | 1 | 0 | 0 | 0 |
Polk County | 8 | 4 | 7 | 12 | 5 |
Pottawattamie County | 3 | 1 | 1 | 4 | 0 |
Poweshiek County | 0 | 1 | 0 | 1 | 0 |
Ringgold County | 0 | 0 | 0 | 1 | 0 |
Sac County | 2 | 0 | 0 | 2 | 2 |
Scott County | 4 | 3 | 9 | 5 | 3 |
Shelby County | 0 | 0 | 2 | 1 | 0 |
Sioux County | 0 | 0 | 1 | 0 | 1 |
Story County | 0 | 0 | 1 | 2 | 1 |
Tama County | 0 | 0 | 0 | 2 | 2 |
Taylor County | 1 | 0 | 0 | 1 | 1 |
Union County | 0 | 0 | 0 | 0 | 0 |
Van Buren County | 0 | 0 | 0 | 0 | 0 |
Wapello County | 0 | 0 | 0 | 0 | 0 |
Warren County | 2 | 2 | 1 | 0 | 1 |
Washington County | 0 | 0 | 0 | 0 | 0 |
Wayne County | 0 | 0 | 0 | 0 | 0 |
Webster County | 1 | 0 | 2 | 2 | 1 |
Winnebago County | 0 | 0 | 0 | 0 | 1 |
Winneshiek County | 0 | 0 | 0 | 0 | 1 |
Woodbury County | 5 | 1 | 6 | 6 | 0 |
Worth County | 0 | 0 | 0 | 0 | 0 |
Wright County | 2 | 0 | 0 | 0 | 1 |
Drunk driving is also a major contributor to crash fatalities. Below we’ve listed all of the fatalities involving a drunk driver.
Compare Quotes From Top Companies and Save
Secured with SHA-256 Encryption
What’s the Number of Fatalities Involving Drunk Driving By County?
County Name | 2013 | 2014 | 2015 | 2016 | 2017 |
---|---|---|---|---|---|
Adair County | 0 | 5 | 0 | 2 | 0 |
Adams County | 0 | 0 | 0 | 0 | 0 |
Allamakee County | 2 | 1 | 1 | 2 | 1 |
Appanoose County | 1 | 1 | 1 | 3 | 0 |
Audubon County | 0 | 1 | 0 | 0 | 2 |
Benton County | 3 | 3 | 1 | 3 | 1 |
Black Hawk County | 3 | 1 | 2 | 1 | 1 |
Boone County | 2 | 0 | 1 | 1 | 0 |
Bremer County | 1 | 0 | 0 | 0 | 0 |
Buchanan County | 0 | 0 | 1 | 1 | 0 |
Buena Vista County | 0 | 1 | 1 | 0 | 0 |
Butler County | 1 | 1 | 0 | 0 | 1 |
Calhoun County | 0 | 1 | 0 | 1 | 3 |
Carroll County | 0 | 3 | 0 | 1 | 2 |
Cass County | 1 | 1 | 1 | 4 | 0 |
Cedar County | 1 | 0 | 1 | 0 | 1 |
Cerro Gordo County | 1 | 1 | 0 | 2 | 8 |
Cherokee County | 0 | 0 | 1 | 1 | 0 |
Chickasaw County | 0 | 1 | 0 | 1 | 0 |
Clarke County | 0 | 0 | 0 | 0 | 0 |
Clay County | 0 | 0 | 0 | 0 | 0 |
Clayton County | 2 | 2 | 1 | 1 | 0 |
Clinton County | 1 | 1 | 1 | 0 | 0 |
Crawford County | 0 | 0 | 0 | 0 | 0 |
Dallas County | 3 | 4 | 3 | 4 | 1 |
Davis County | 0 | 0 | 0 | 0 | 0 |
Decatur County | 0 | 1 | 0 | 0 | 2 |
Delaware County | 2 | 0 | 0 | 0 | 0 |
Des Moines County | 1 | 1 | 1 | 3 | 1 |
Dickinson County | 0 | 0 | 0 | 1 | 1 |
Dubuque County | 1 | 2 | 1 | 0 | 1 |
Emmet County | 1 | 0 | 0 | 0 | 0 |
Fayette County | 0 | 1 | 0 | 1 | 0 |
Floyd County | 1 | 0 | 0 | 0 | 0 |
Franklin County | 2 | 0 | 0 | 0 | 1 |
Fremont County | 1 | 1 | 0 | 1 | 2 |
Greene County | 0 | 0 | 0 | 2 | 0 |
Grundy County | 1 | 0 | 0 | 0 | 0 |
Guthrie County | 0 | 1 | 1 | 0 | 0 |
Hamilton County | 0 | 0 | 0 | 2 | 0 |
Hancock County | 3 | 0 | 0 | 0 | 2 |
Hardin County | 0 | 1 | 1 | 1 | 0 |
Harrison County | 0 | 1 | 1 | 0 | 0 |
Henry County | 1 | 0 | 1 | 1 | 0 |
Howard County | 0 | 0 | 0 | 0 | 0 |
Humboldt County | 2 | 1 | 0 | 1 | 1 |
Ida County | 0 | 0 | 1 | 0 | 0 |
Iowa County | 0 | 0 | 1 | 1 | 2 |
Jackson County | 0 | 1 | 0 | 1 | 0 |
Jasper County | 1 | 0 | 0 | 1 | 1 |
Jefferson County | 0 | 0 | 0 | 0 | 0 |
Johnson County | 1 | 3 | 0 | 7 | 1 |
Jones County | 1 | 3 | 1 | 0 | 0 |
Keokuk County | 1 | 1 | 0 | 0 | 0 |
Kossuth County | 1 | 0 | 1 | 0 | 0 |
Lee County | 2 | 1 | 3 | 3 | 1 |
Linn County | 4 | 4 | 0 | 4 | 1 |
Louisa County | 0 | 2 | 1 | 0 | 0 |
Lucas County | 0 | 0 | 0 | 1 | 1 |
Lyon County | 2 | 0 | 0 | 0 | 0 |
Madison County | 1 | 0 | 3 | 2 | 0 |
Mahaska County | 0 | 2 | 1 | 0 | 0 |
Marion County | 1 | 1 | 0 | 1 | 0 |
Marshall County | 2 | 1 | 0 | 1 | 5 |
Mills County | 1 | 1 | 0 | 1 | 1 |
Mitchell County | 1 | 0 | 0 | 1 | 0 |
Monona County | 1 | 0 | 2 | 2 | 2 |
Monroe County | 0 | 0 | 2 | 1 | 0 |
Montgomery County | 0 | 0 | 1 | 0 | 0 |
Muscatine County | 0 | 0 | 0 | 2 | 1 |
O Brien County | 1 | 0 | 1 | 0 | 0 |
Osceola County | 0 | 1 | 0 | 1 | 2 |
Page County | 1 | 1 | 0 | 0 | 0 |
Palo Alto County | 0 | 0 | 0 | 0 | 1 |
Plymouth County | 0 | 0 | 0 | 1 | 1 |
Pocahontas County | 0 | 1 | 0 | 0 | 1 |
Polk County | 7 | 6 | 7 | 10 | 6 |
Pottawattamie County | 4 | 3 | 3 | 3 | 5 |
Poweshiek County | 1 | 2 | 0 | 0 | 1 |
Ringgold County | 0 | 0 | 0 | 0 | 0 |
Sac County | 0 | 2 | 0 | 0 | 0 |
Scott County | 6 | 5 | 10 | 6 | 1 |
Shelby County | 1 | 0 | 0 | 0 | 0 |
Sioux County | 1 | 0 | 0 | 1 | 0 |
Story County | 0 | 1 | 1 | 0 | 1 |
Tama County | 3 | 0 | 0 | 0 | 3 |
Taylor County | 1 | 0 | 0 | 0 | 1 |
Union County | 0 | 0 | 0 | 2 | 0 |
Van Buren County | 0 | 0 | 0 | 0 | 0 |
Wapello County | 0 | 0 | 1 | 2 | 1 |
Warren County | 2 | 0 | 6 | 1 | 2 |
Washington County | 0 | 2 | 0 | 0 | 2 |
Wayne County | 0 | 0 | 0 | 0 | 2 |
Webster County | 2 | 0 | 0 | 2 | 2 |
Winnebago County | 0 | 1 | 0 | 0 | 0 |
Winneshiek County | 1 | 0 | 1 | 2 | 1 |
Woodbury County | 6 | 1 | 4 | 2 | 1 |
Worth County | 0 | 1 | 0 | 0 | 0 |
Wright County | 2 | 0 | 1 | 0 | 1 |
What’s the Number of Fatalities Related to Teen Drinking and Driving?
In 2016, Iowa law enforcement arrested 71 teenagers (under the age of 18) for drunk driving.
This number places Iowa as the 20th worst state in the U.S. for underage drinking and driving.
Below are the facts concerning underage (under 21 years old) drinking-related fatalities:
- .08 fatalities per 100,000 people in Iowa
- 1.2 fatalities per 100,000 people national average
Now that we have covered drunk driving fatalities and arrests, let’s look at EMS response times in Iowa.
What’s the EMS Response Time?
If you or someone you know is in an accident, you want help to arrive as FAST as possible. Check out the response times for emergency personnel in rural and urban areas.
Type of Crash | Time of Crash to EMS Notification | EMS Notification to EMS Arrival | EMS Arrival at Scene to Hospital Arrival | Time of Crash to Hospital Arrival |
---|---|---|---|---|
Rural | 6.21 min. | 12.11 min. | 32.39 min. | 50.57 min. |
Urban | 3.88 min. | 6.28 min. | 19.72 min. | 28.20 min . |
Compare Quotes From Top Companies and Save
Secured with SHA-256 Encryption
What’s Transportation in Iowa like?
When you drive through your neighborhood, do you ever notice how many cars are sitting in your neighbors’ driveways? Usually, we can tell if someone is visiting by that extra car parked outside the house.
The average household in Iowa has two cars to three cars.
What’s the Average Commute Time?
The average commute time in the U.S. is 25.3 minutes. Fortunately, Iowa’s average commute time is only 18.6 minutes.
What’s the Preferred Commuter Transportation?
In every state, driving alone is the most common commute option, though people are beginning to turn to other commute options like carpooling and working from home.
Now that you’ve read through this comprehensive guide, and know everything there is to know about buying car insurance in Iowa, it’s time to hit the road.
Don’t just flyover or drive like hell through Iowa, because the folks in Jewell sum it up best: “We’re a gem, in a friendly setting.”
Enter your zip code below to get a free quote comparison.