Distracted Pedestrians & Deadly Accidents [Study Results]
New Mexico is the most dangerous state for pedestrians, with 3.5 pedestrian deaths per 100,000 residents. North Dakota is the best state for pedestrians, with 0.6 pedestrian deaths per 100,000 residents. Drivers report that the No. 1 behavior distracted pedestrians do is looking at their phones while walking.
Read more Secured with SHA-256 Encryption


Table of Contents
Table of Contents


Sr. Director of Content
Sara Routhier, Senior Director of Content, has professional experience as an educator, SEO specialist, and content marketer. She has over 10 years of experience in the insurance industry. As a researcher, data nerd, writer, and editor, she strives to curate educational, enlightening articles that provide you with the must-know facts and best-kept secrets within the overwhelming world of insurance....
Sara Routhier


Licensed Insurance Agent
Eric Stauffer is an insurance agent and banker-turned-consumer advocate. His priority is educating individuals and families about the different types of insurance coverage. He is passionate about helping consumers find the best coverage for their budgets and personal needs. Eric is the CEO of C Street Media, a full-service marketing firm and the co-founder of ProperCents.com, a financial educat...
Eric Stauffer
Updated March 2025
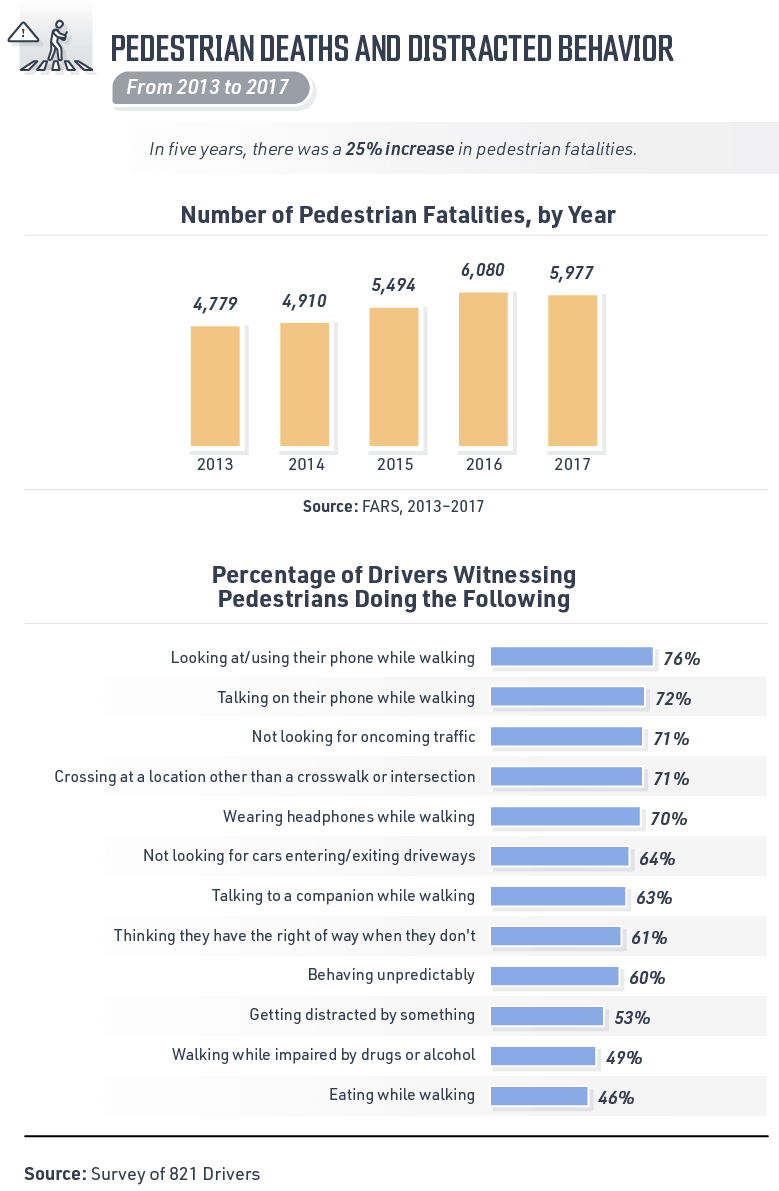
- From 2013-2017, pedestrian fatalities in America increased by 25 percent
- 76 percent of drivers surveyed saw pedestrians distracted by their phones
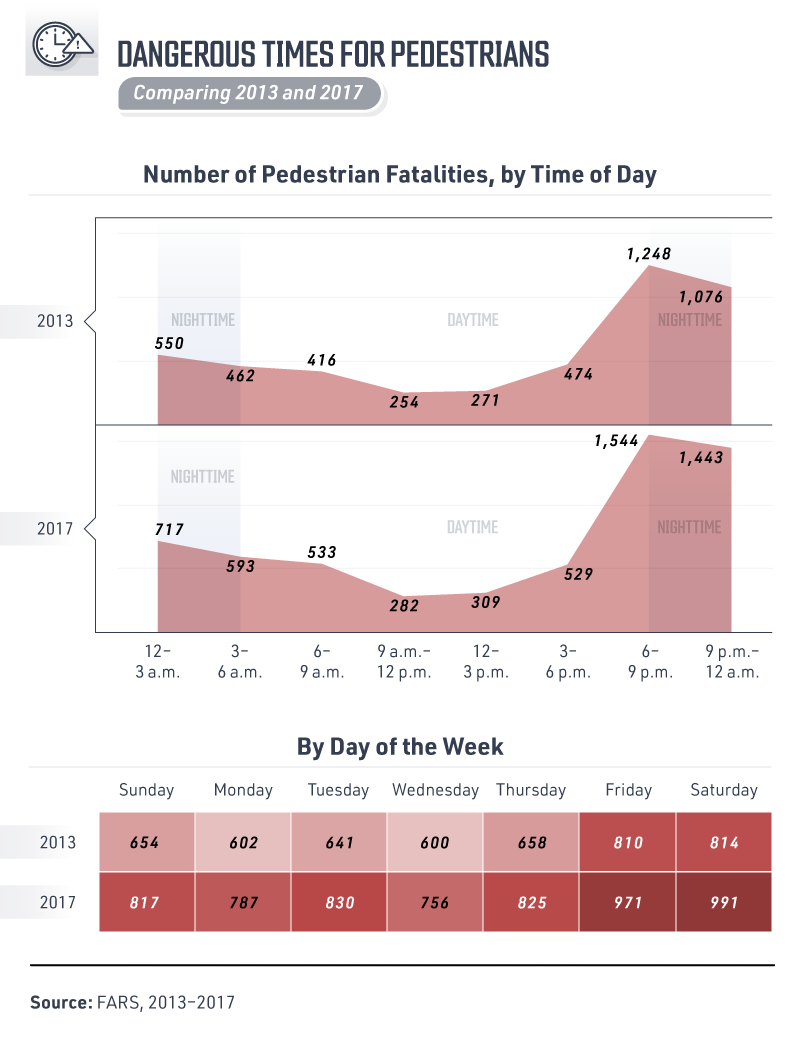
- From 6 p.m. – 6 a.m., there were 4,297 pedestrians killed in 2017
- On average in 2017, 16 pedestrians were killed each day in crashes

If you’ve ever jogged through a well-trafficked neighborhood or taken a stroll through the car-jammed streets of a city, you’ve probably encountered a potentially dangerous situation with a vehicle.
In the least, you understood that moving vehicles and pedestrians aren’t always paying attention to one another. Perhaps you noticed an unfortunate problem with this issue but not on the driver’s side. That is, distracted pedestrians.
What happens as the number of vehicles on the road increases and the distraction of our technology becomes just as much of a problem for pedestrians as it is for drivers?
Pedestrian deaths have risen steadily over the past few years, up 25 percent from 2013 to 2017, according to data from the Fatality Analysis Reporting System (FARS) from the National Highway Traffic Safety Administration.
Our project paired survey data collected from over 820 drivers with pedestrian data from FARS to show how prevalent distracted walking is and its deadly effects. What we found: Distracted pedestrians are a problem.
Our study found that in 2017, an average of 16 pedestrians died in an accident every day. In this article, we’ll go through a distracted walking definition and the consequences related to distracted walking.
Of course, while preventing pedestrian fatalities are the most important part of correcting these behaviors, fatal traffic accidents can also have an impact on the car insurance rates of those who live in those areas.
As many people know, car insurance rates can rise in areas with high traffic deaths because people submit more claims, which costs the insurance companies more money. Fortunately, we can help. To get the best rates in your area, even with distracted pedestrians on the roads, plug your ZIP code into our free, online quote comparison tool.
You can also check out one of our car insurance guides which covers everything about different types of car insurance, what you need to know about fraud, and what to do after an accident.
Now, read on to learn more about pedestrian fatalities across America.
Dangers of Distracted Walking
While a distracted driver is a known hazard, distracted pedestrians are all too common as well. 72 percent of drivers report that they’ve seen an increase in distracted pedestrian behavior over the past five years, according to our study using FARS data.
One possible explanation for this is the hurriedness of modern life putting pressure on people to multitask while in transport. In the back of an Uber, using electronic devices to catch up on an email, or talk to a companion is fairly safe; while walking, this behavior can be deadly.
Seventy-nine percent of drivers had seen a distracted pedestrian in the last month, with 35 percent reporting seeing one at least once a week.
Drivers reported most often seeing pedestrians distracted by their phones; indeed, around three-quarters of drivers saw a pedestrian looking at, using, or talking on their phone while walking.
Other dangerous pedestrian behaviors included not looking for oncoming traffic and crossing at locations other than a crosswalk or intersection. Less common — but still prevalent — behaviors included wearing headphones, talking to a friend, and eating, all while walking on the street.
Free Insurance Comparison
Compare Quotes From Top Companies and Save
Secured with SHA-256 Encryption
Emerging Trends in Distracted Walking and Pedestrian Safety
Distracted pedestrian statistics reveal that distracted pedestrians walk into accidents with increasing frequency. As technology and multitasking become more prevalent, distracted walking is a growing concern, not only in everyday scenarios but also in contexts such as distracted walking at work.
The rise in distracted walking underscores the need for improved safety measures. To address this issue, distracted walking safety tips are crucial for both pedestrians and drivers. Additionally, distracted walking statistics in Canada echo similar trends observed globally, highlighting the importance of heightened awareness and preventive strategies.
Overview of Distracted Walking Statistics
The rise of smartphones and other digital devices has led to a significant increase in distracted walking statistics. As technology becomes more integrated into our daily lives, distracted pedestrians have become a growing concern. In 2023, distracted walking statistics for 2023 revealed a disturbing trend where pedestrians are increasingly shifting their focus away from the roadway, contributing to a higher number of accidents.
Distracted Walking Statistics: A Yearly Comparison
Comparing distracted walking statistics for 2022 to 2023, we observe a troubling escalation in pedestrian accidents. Distracted walking accidents have surged, highlighting that distracted pedestrians are a problem that cannot be ignored. The data suggests that distracted pedestrians are a concern due to their increased involvement in accidents.
Key Behaviors and Regional Data
Problematic Pedestrian Behaviors: Problematic pedestrian behaviors include texting, talking on the phone, and other activities that divert attention from traffic. Research indicates that distracted pedestrians shift their focus away from the roadway, leading to a rise in accidents. While many of these behaviors are well-known, it’s crucial to understand which ones are most prevalent and dangerous.
The Five Most Dangerous States for Pedestrians: The five most dangerous states for pedestrians have consistently shown high numbers of pedestrian fatalities. These states are particularly affected by high rates of distracted walking and distracted driving crashes per year, which contribute to increased distracted driving fatalities and distracted driving deaths.
Impact of Distracted Driving on Pedestrian Safety
Deaths Caused by Distracted Driving: Deaths caused by distracted driving have a direct impact on pedestrian safety. According to distracted driving death statistics, the number of fatalities linked to distracted driving is alarmingly high. Distracted driving deaths per year continue to rise, with distracted driving fatalities being a significant contributor to pedestrian accidents.
Deaths from Texting and Driving: Deaths from texting and driving are a subset of distracted driving deaths, representing a critical area of concern. The link between texting while driving and pedestrian fatalities underscores the importance of addressing distracted driving crashes as part of a broader strategy to improve road safety.
Free Insurance Comparison
Compare Quotes From Top Companies and Save
Secured with SHA-256 Encryption
Addressing Distracted Pedestrian and Driving Behaviors
In 2016, most pedestrian fatalities occurred between the hours of evening and nighttime, highlighting a concerning trend in pedestrian safety.
The increase in pedestrian deaths over the years has been alarming, with a significant number of fatalities linked to distracted behaviors such as jaywalking and eating while driving. Although studies show that eating while driving statistics have improved, the overall danger remains high.
Notably, the least dangerous state for pedestrians, North Dakota, contrasts sharply with states experiencing high pedestrian fatalities. This disparity underscores the need for continued vigilance and improved safety measures to address distracted driving and walking behaviors effectively.
All of the Following Are Dangerous Pedestrian Behaviors Except
It is important to identify which behaviors contribute to pedestrian accidents. All of the following are dangerous pedestrian behaviors except those that do not involve significant distractions. Understanding these behaviors can help in developing targeted strategies to mitigate risks.
Distracted Driving Quotes and Awareness Campaigns
Distracted driving quotes and awareness campaigns play a crucial role in highlighting the dangers of distracted driving and distracted pedestrians. Increasing public awareness through compelling messages can help in reducing both distracted driving crashes per year and distracted walking accidents.
By focusing on these emerging trends and statistics, we can better address the issue of distracted walking and its impact on pedestrian safety, ultimately working towards reducing both distracted driving fatalities and distracted walking statistics.
Pedestrian Safety and Fatalities: Key Insights
Pedestrian accident statistics reveal troubling trends, especially in the most dangerous states per capita. For instance, New Mexico is the most dangerous state for pedestrians, with a high rate of pedestrian fatalities. Each year, the number of pedestrians hit by cars and the number of pedestrians killed by cars continues to rise, highlighting the need for better safety measures.
In particular, jaywalking deaths per year contribute significantly to these statistics, exacerbating the risks faced by pedestrians. Additionally, most school-age pedestrians who lost their lives tend to be involved in accidents during peak traffic times. The data indicates that most pedestrian fatalities occur during evening and nighttime hours.
Comparing across various states, F1 driver fatalities and their influence on overall traffic safety offer context but are distinct from the pedestrian-specific issues. Overall, understanding these patterns helps in targeting safety improvements and reducing the number of pedestrian accidents.
The Most Dangerous Times for Pedestrians
Evening and nighttime were the most dangerous times to be a pedestrian, according to FARS data.
The hours of 6 p.m. to midnight were the most dangerous times for pedestrians, and this got steadily worse over the past five years.
In fact, while pedestrian injuries and deaths in the daytime stayed relatively the same, fatalities from 9 p.m. to midnight increased by 34 percent from 2013 to 2017, and deaths from midnight to 3 a.m. increased by 30 percent in the same time frame.
Pedestrian deaths at night have increased considerably since 2013, according to our data:
- 3,336 nighttime deaths occurred in 2013
- 4,297 nighttime deaths occurred in 2017
If we calculate the percentage change for this specific time of day, nighttime pedestrian deaths increased by 29 percent in just five years. Luckily, daytime deaths didn’t increase as drastically as those that occurred in the dark:
- 1,415 daytime deaths in 2013
- 1,653 daytime deaths in 2017
There was around a 17 percent increase in daytime pedestrian fatalities, which is still reason enough for pedestrians to stroll in the daylight with caution.
Free Insurance Comparison
Compare Quotes From Top Companies and Save
Secured with SHA-256 Encryption
How Nervous Drivers Cause Traffic Deaths
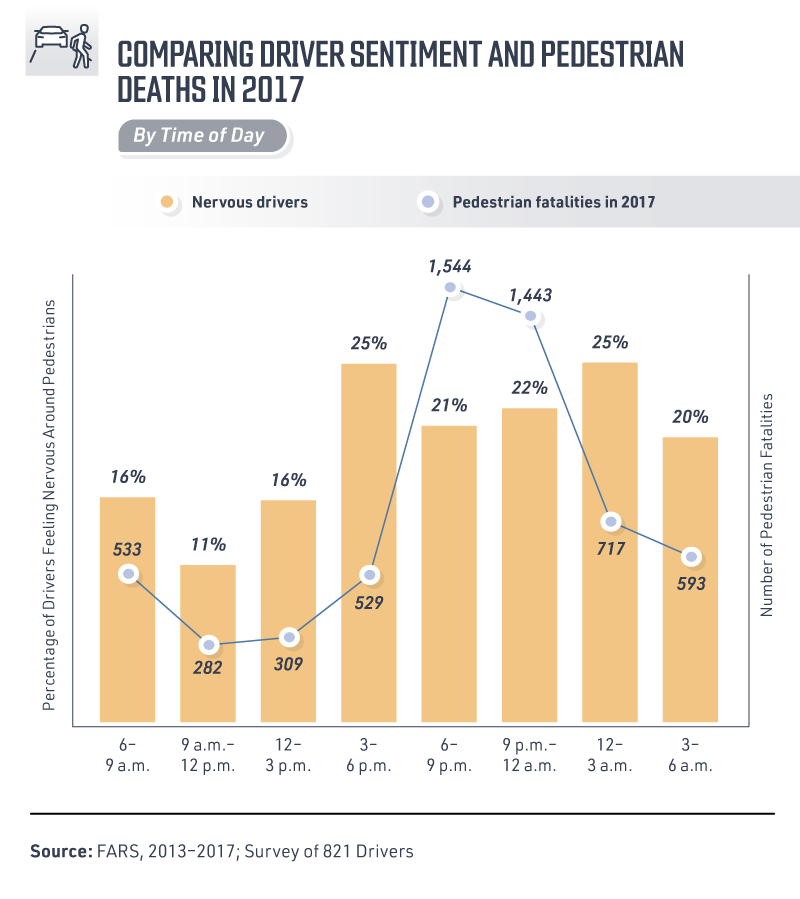
Interestingly, when asked how nervous drivers were with respect to behavior of pedestrians at various times of day and night, people’s nervousness did not follow the observed pattern of pedestrian deaths.
Nearly a quarter of all drivers reported being most nervous to drive between 3 p.m. and 6 p.m. and between midnight and 3 a.m. when accidents resulting in pedestrian deaths were considerably less common than at night.
While survey respondents were not asked why certain times of day made them more nervous than others, one can speculate that 3 p.m. to 6 p.m. is rush hour for most commuters, which means more cars on the road traveling home from work. Commuters are often some of the most distracted walkers, as they have a tendency to check their cell phone as they make their way to their car or commuter train.
Additionally, schools let out during this time, and an increase in foot traffic is enough to make any experienced driver nervous.
At-Risk Pedestrians, by Demographic
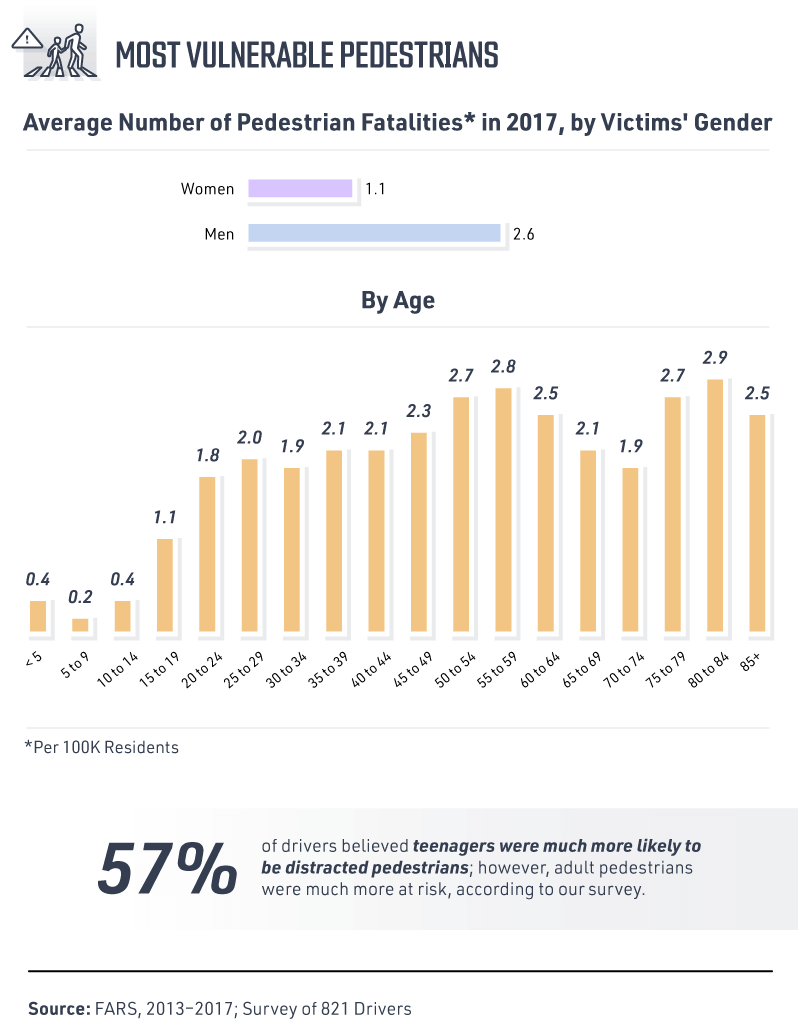
When we think about the risk to pedestrians, we also need to consider their age group, namely those who are most at risk of being a casualty. The graphs below describe pedestrian deaths by age.
They have been normalized per 100,000 residents based on U.S. census data to account for fluctuations.
Men were about 2.4 times more likely than women to die as pedestrians, a pattern that emerged among teenagers and remained true for all age groups. Additionally to the data shown, we found that male pedestrian deaths also increased more significantly since 2013:
- 2017 data shows male deaths were up 21 percent since 2013.
- Female deaths only rose by 13 percent in 2017 compared to 2013.
Surprisingly enough, we found that casualties per 100,000 residents were actually higher for adults. This contrasted with our survey data: 57 percent of drivers said they believed teenagers to be more at risk for distracted walking.
The Most Dangerous Pedestrian States
It’s worth repeating: In 2017, an average of 16 pedestrians died in an accident every day. With that grim reality in mind, there was also a huge variance in pedestrian deaths across the U.S.
It’s a reasonable assumption that a high number of fatal accidents in a state might mean more pedestrians are at risk.
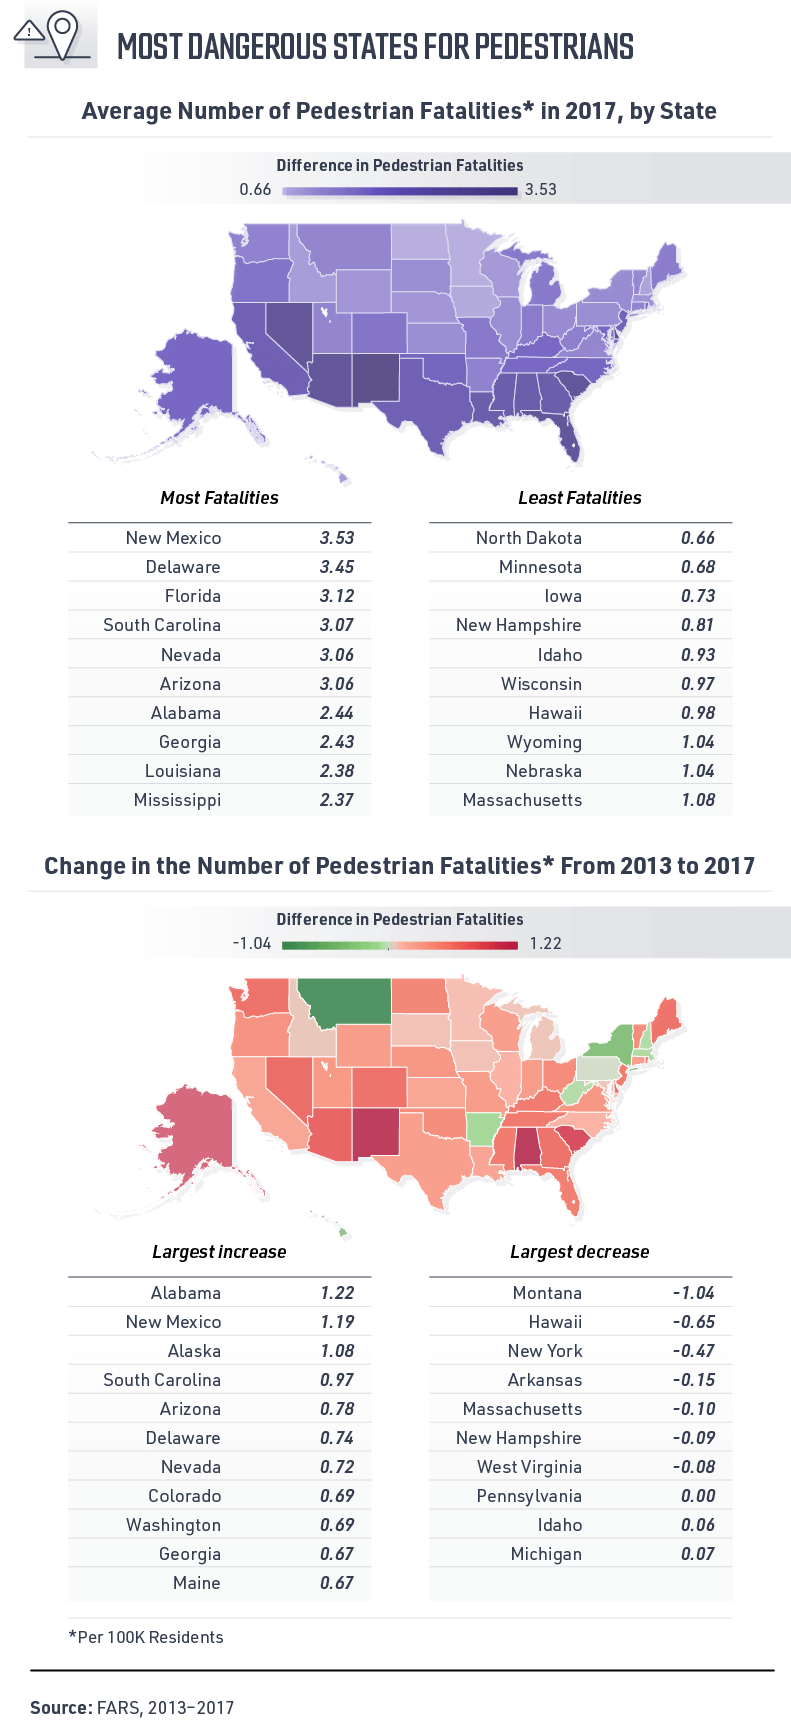
The safest states for pedestrians, North Dakota, Minnesota, Iowa, New Hampshire, and Idaho, all had less than one pedestrian death per 100,000 people in 2017.
The most dangerous states for pedestrians were over three times as dangerous than the safest ones: New Mexico (3.53 per 100,000), Delaware (3.45), Florida (3.12), South Carolina (3.07), Nevada (3.06), and Arizona (3.06).
When we analyzed the data from 2013 and compared it to the most recent, we found that all of these states saw significant increases since 2013, as did Alaska, Alabama, and Arizona.
A few states managed to decrease pedestrian deaths since 2013, despite rising national averages. Montana, Hawaii, and New York saw a decrease in pedestrian deaths by 0.5 to one death per 100,000 residents.
A further examination of policy, behavioral, and demographic changes in these states are required to understand the improvement in per-capita pedestrian deaths, though.
Read more: America’s Safest Driving Cities
Free Insurance Comparison
Compare Quotes From Top Companies and Save
Secured with SHA-256 Encryption
Pedestrian Accident Scenarios
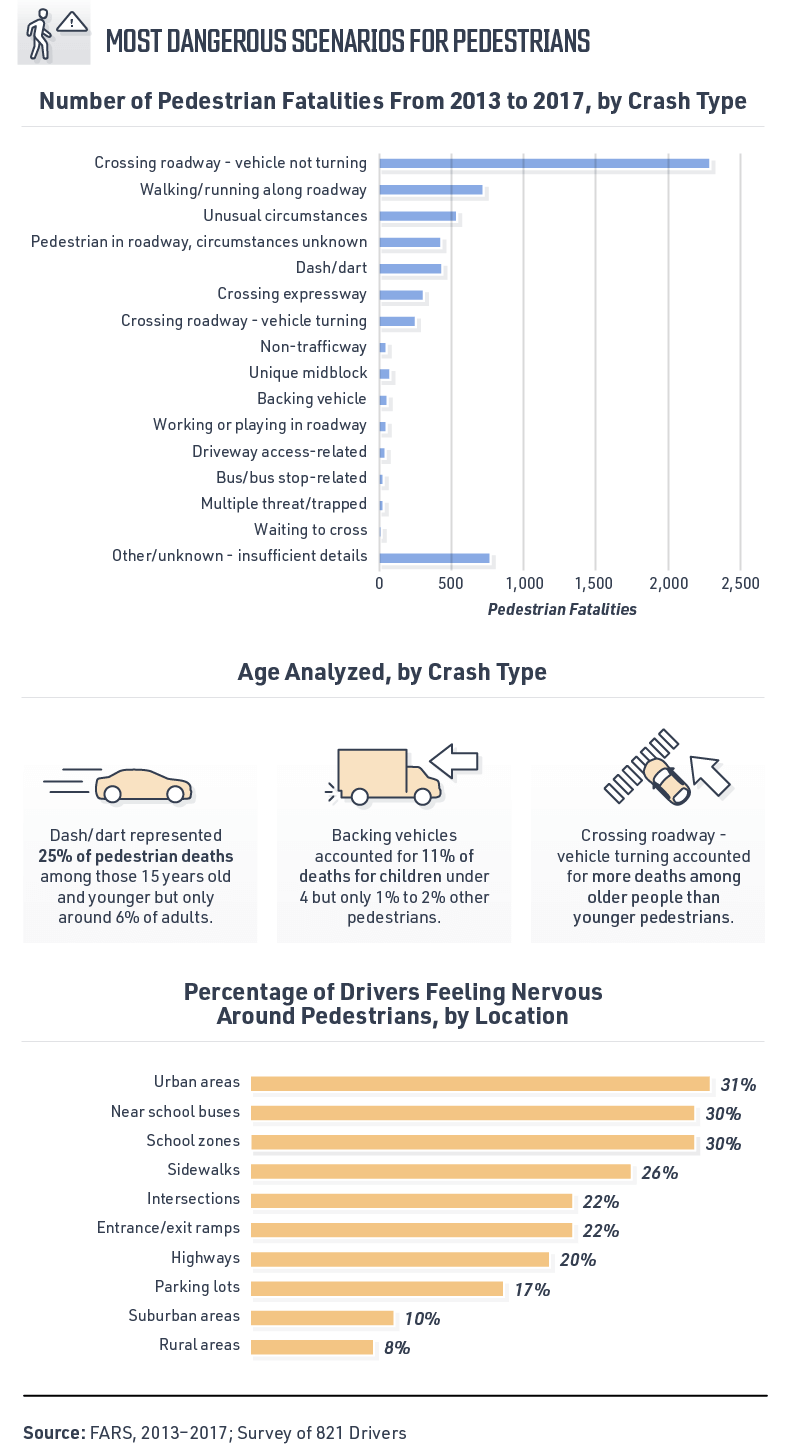
When fatal accidents involving pedestrians occur, they are categorized by FARS into various scenarios that describe the way the pedestrian and driver came into contact — offering an interesting perspective into the most dangerous vehicle maneuvers for pedestrians.
By far, the most common scenario in which pedestrians were killed was when they crossed roadways.
All scenarios in which pedestrians crossed (crossing a roadway or expressway) whether the vehicle was turning or not, accounted for 47 percent of pedestrian deaths in 2017.
Other scenarios where pedestrians were in the roadway – walking/running along the roadway, dashing/darting, working or playing in the roadway, etc. — accounted for 27 percent of pedestrian deaths.
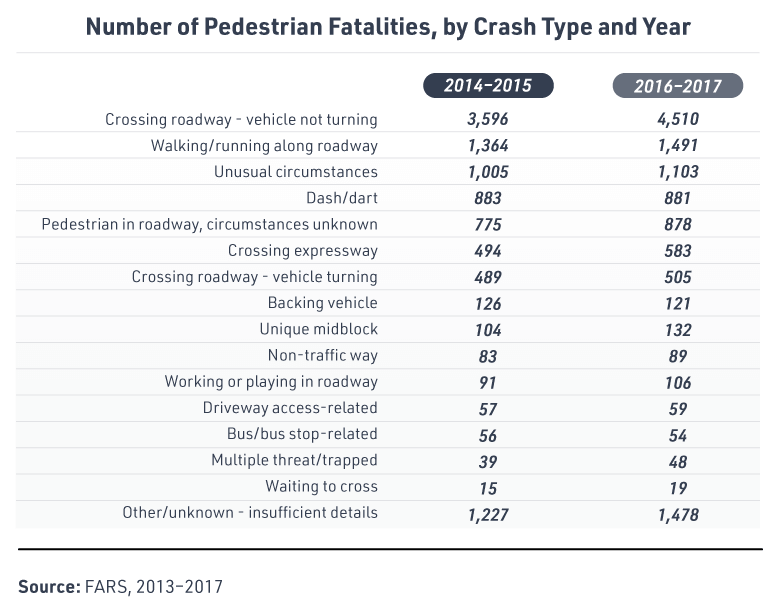
How has this changed with time? Deaths by roadway crossings were up by nearly 1,000 casualties in the most recent two years of data analyzed. Take a look at the chart below to see just how many pedestrian casualties there have been from previous years.
Combating Fatalities with Heightened Awareness
What are the biggest problems we face when talking about pedestrian safety on the roads? The largest increases in pedestrian fatalities since 2013 involved pedestrians crossing roadways and walking in the dark.
But with those stats, as well as those supporting the prevalence of distracted walking, it seems the responsibility has to be on both the driver and the walker.
The relationship between the rise of smartphone use and pedestrian deaths is not unrelated.
Since 2009, there has been a fivefold increase in smartphone use, along with an even larger increase in data usage. In response, pedestrian deaths have continued to rise along with driver casualties.
So while more agencies are shedding light on increasing pedestrian deaths, what can we do now to alleviate this tragic problem? Certainly being alert and cognizant behind the wheel is one big step in the right direction.
Pedestrians and drivers could also learn from sensitivity training to change their behaviors to prevent more pedestrian accidents.
And more and more car companies are developing or implement technology to prevent pedestrian deaths according to the Insurance Institute for Highway Safety (IIHS).
These include pedestrian detection symptoms and other tools that alert a driver of an object they can’t see easily (like technology sensing objects in the driver’s blind spots).
On the other hand, technology may play a role in causing more pedestrian deaths. This is the case with hybrid vehicles, which researchers have found are 20 percent more likely to hit pedestrians.
There is a very simple explanation for this: A pedestrian can’t hear a hybrid car coming, leading to more hybrid cars causing pedestrian accidents.
Frequently Asked Questions: Bad & Dangerous Driving Behavior
Now that we’ve covered the main forms of pedestrian distracted behavior and the accident or traffic deaths they may cause, let’s get to your frequently asked questions. These include:
- How many pedestrians are killed by distracted drivers?
- How can pedestrians cause accidents?
- What kills more — texting or drinking?
And many more. Let’s dive right in.
#1 – How many pedestrians are killed by distracted drivers?
In 2018, according to the National Highway Traffic Safety Administration (NHTSA), a little over 2,800 people were killed by distracted drivers. That includes 400 pedestrians and 77 bicyclists.
#2 – What are the safety rules for pedestrians?
Some safety rules involve paying extra attention to the roads, not jogging on roads during the morning, always holding the hands of children when crossing the street, don’t move between parked or stopped cars where an incoming car might not see you, and making eye contact with drivers.
#3 – How can pedestrians cause accidents?
As we’ve seen in this study, pedestrians can cause accidents by being distracted and not paying attention to the road. Drivers surveyed for this study say the biggest distraction pedestrians have when walking down the street is looking at their cell phones while doing so. This decreases awareness and can lead to accidents.
#4 – Where do the majority of pedestrian fatalities occur?
Most pedestrian deaths occur in urban areas, on roads where there is a high allowed speed, and at night, which obscures the driver’s ability to see the pedestrian.
#5 – What kills more — texting or drinking?
While some experts believe texting and driving is more dangerous than driving, according to the NHTSA, just 2,800 traffic deaths were caused by texting and driving in 2018. In that same year, 10,500 people were killed in fatal crashes involving a drunk driver.
#6 – How many Americans have died from distracted driving?
A little over 2,800 people died due to distracted driving in 2018, which represented a decline from 3,450 in 2016. However, while this is a fall, texting, and driving (perhaps the main distracted driving behavior that leads to fatal crashes) continues to affect teenagers disproportionally, with most of the texting and driving deaths coming from that age group.
#7 – How do I stop hitting pedestrians?
The main way for a person to stop hitting pedestrians is to be aware — not just of the road but the pedestrians as well. Obeying school signs, noticing whether a person might try to cross the road, or taking into account when a pedestrian is distracted, can all reduce your odds of hitting a pedestrian.
#8 – What are the five safety rules?
The five that some believe are the most important are to never drink and drive, always wear a seat belt, avoid driving distractions, don’t follow too close, and don’t cross a red light.
Free Insurance Comparison
Compare Quotes From Top Companies and Save
Secured with SHA-256 Encryption
Methodology: Statistical Analysis of Pedestrian Deaths
- We analyzed five years of data from NHTSA’s Fatality Analysis Reporting System (FARS) to examine pedestrian deaths due to vehicles in America.
- For visualizations including demographic population data, we calculated fatalities per capita using the U.S. census to normalize our data.
- We also surveyed 821 drivers to see what pedestrian behaviors drivers observed that could potentially lead to dangerous situations.
- For our survey data, we did not have a validated measure of “pedestrian nervousness” so we created a linear Likert scale of 1 to 5, with 1 being “not at all nervous” and 5 being “extremely nervous.”
- Because our survey is a survey of drivers observing pedestrian behaviors, certain limitations apply such as exaggeration, telescoping, and selective memory.
Beyond getting free car insurance comparisons by ZIP code, our resources can also help you understand how to be a more defensive driver, so you can keep your family safe and protected on the road from distracted pedestrians.
Fair Use Statement
Do you think these pedestrian distraction study results will help keep your loved ones safe while walking on the roads? Feel free to share our study for noncommercial purposes, but don’t forget to link back to this page to properly credit our work.
Frequently Asked Questions
How many accidents are caused by distracted driving each year?
In 2018, distracted driving was responsible for over 2,800 fatalities, including 400 pedestrians and 77 bicyclists.
How many deaths are caused by texting and driving each year?
Texting and driving caused around 2,800 traffic deaths in 2018.
How many nonoccupants are killed daily in accidents caused by distracted drivers in the United States?
Approximately 400 pedestrians and 77 bicyclists were killed in accidents caused by distracted drivers in 2018, averaging over one nonoccupant death each day.
How many pedestrians are killed each day in traffic accidents?
On average, 16 pedestrians die in traffic accidents each day.
How many pedestrians are killed each year?
In 2017, approximately 5,884 pedestrians were killed in traffic accidents in the United States.
How many pedestrians are killed by cars each year?
The number of pedestrians killed by cars each year is included in the total pedestrian fatalities, which was about 5,884 in 2017.
How many pedestrians are killed each year in the United States?
In 2017, the total number of pedestrian deaths in the United States was around 5,884.
How many pedestrians are hit by cars each year?
The exact number of pedestrians hit by cars each year is not specified, but the total number of pedestrian fatalities was approximately 5,884 in 2017.
How many people are killed by distracted driving each year?
In 2018, over 2,800 people were killed by distracted driving.
How many people die each year from distracted driving?
Approximately 2,800 people died due to distracted driving in 2018.
How many people die each year from texting and driving?
How many people die annually from distracted driving?
Is Florida the most dangerous state for pedestrians?
Is Minnesota a dangerous state for pedestrians?
Is New Mexico a dangerous state for pedestrians?
Is New Mexico the most dangerous state for pedestrians?
Get a FREE Quote in Minutes
Insurance rates change constantly — we help you stay ahead by making it easy to compare top options and save.
