
The 20 Most Dangerous U.S. Cities for Cyclists [+Death Totals]
Tucson, Arizona, tops the list of the 20 most dangerous U.S. cities for cyclists, with 1.26 fatalities per 100,000 people. Some of the worst states for cyclists include Arizona, California, Michigan, and Texas. On the other hand, Atlanta and Denver are some of the least deadly cities for bicyclists.
Read more![]() Secured with SHA-256 Encryption
Secured with SHA-256 Encryption


Table of Contents
Table of Contents

Sr. Director of Content
Sara Routhier, Senior Director of Content, has professional experience as an educator, SEO specialist, and content marketer. She has over 10 years of experience in the insurance industry. As a researcher, data nerd, writer, and editor, she strives to curate educational, enlightening articles that provide you with the must-know facts and best-kept secrets within the overwhelming world of insurance....
Sara Routhier

Licensed Insurance Agent
Eric Stauffer is an insurance agent and banker-turned-consumer advocate. His priority is educating individuals and families about the different types of insurance coverage. He is passionate about helping consumers find the best coverage for their budgets and personal needs. Eric is the CEO of C Street Media, a full-service marketing firm and the co-founder of ProperCents.com, a financial educat...
Eric Stauffer
Updated February 2025
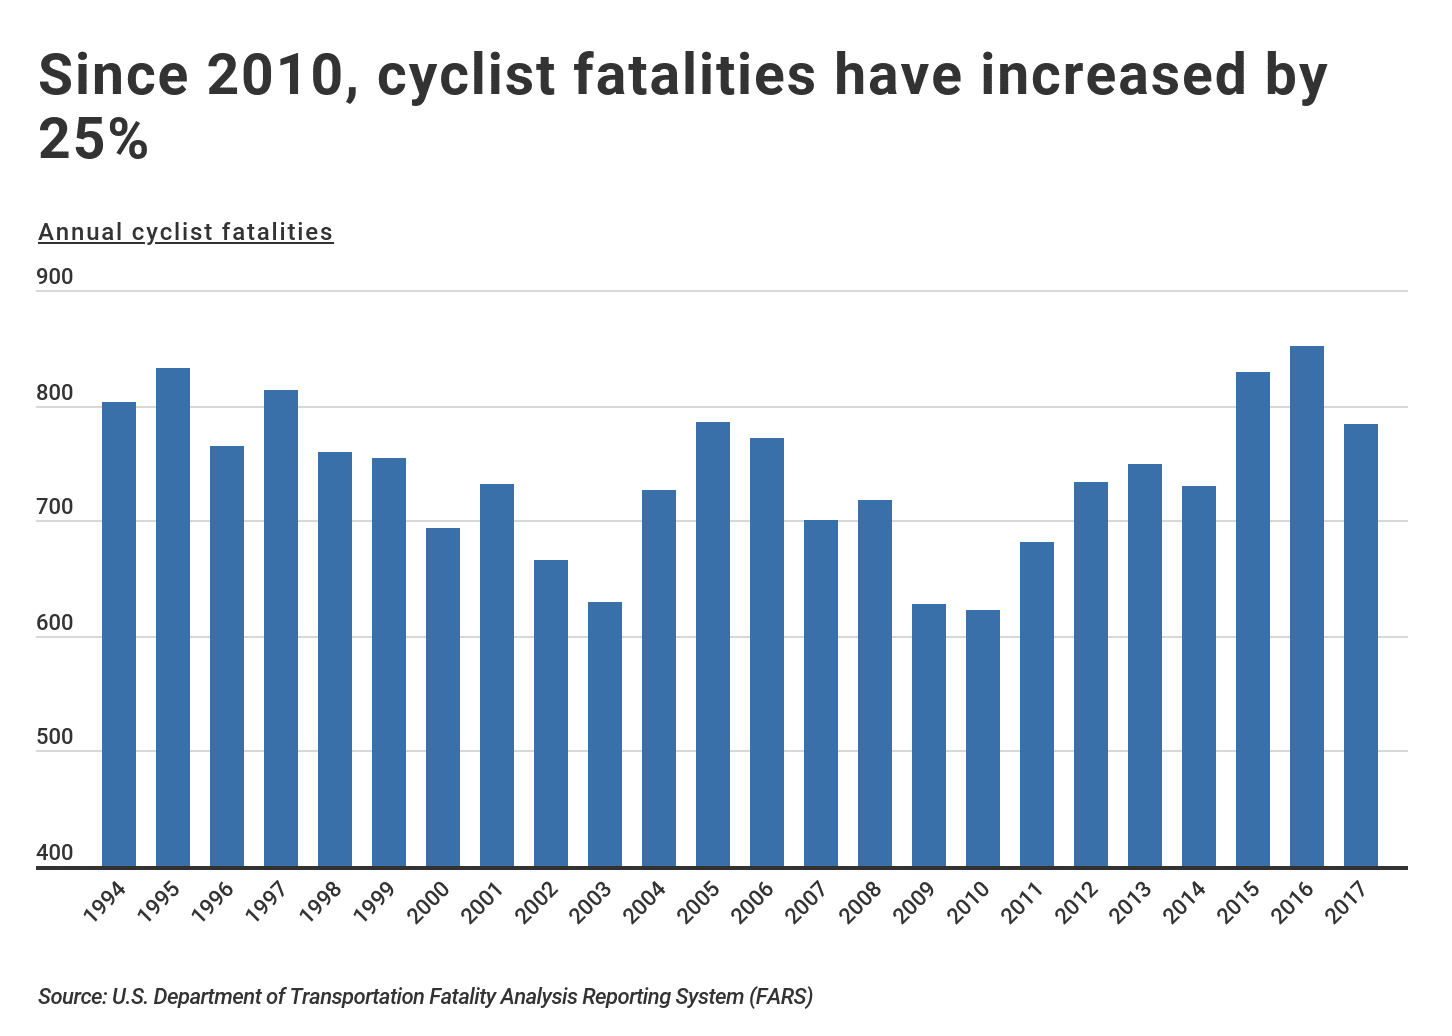
- Since 2010, cyclist fatalities have increased by 25%
- States with the worst cities for bike safety include Arizona, Michigan, and Florida
- Daylight savings time switches can have deadly consequences for cyclists
Commuters looking to reduce their environmental footprint may want to think twice about safety before hopping on a bike. How dangerous is cycling? According to the National Highway Traffic Safety Administration, the number of cyclist deaths has been rapidly increasing over the past several years.
In 2017 alone, there were 783 total cyclist fatalities nationwide, a 25% increase since 2010.
In this article, we look at 77 cities to find the 20 most dangerous U.S. Cities for cyclists. The genesis of this article started with two simple questions: Which cities were most dangerous for cyclists and why?
Increases in fatal bicycle accidents have occurred alongside increases in bike-share programs and the number of total cyclists commuting to work. In 2017, there were nearly 800,000 commuters nationwide who rode their bicycles to work, representing 0.5% of all commuters. While the share of bike commuters has remained steady in recent years, the fatality rate per 100,000 bike commuters is at a ten-year high.
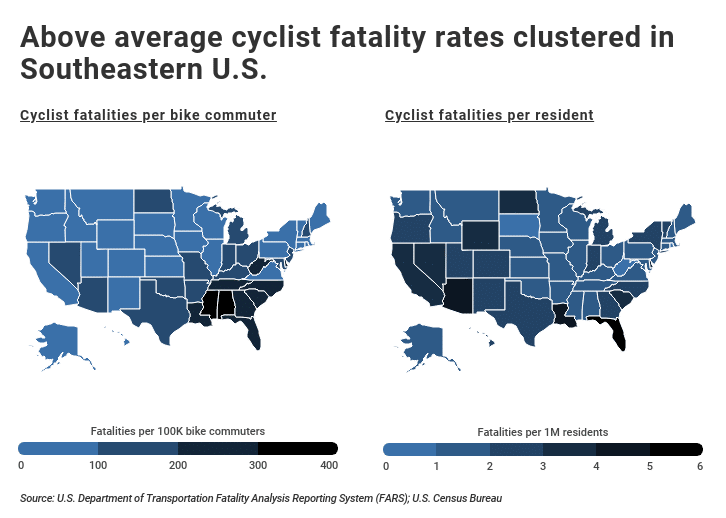
Although cyclist fatalities have been on the rise nationwide, the risk varies widely by location.
Between 2014 and 2017, California, Florida, and Texas, were responsible for about 41% of all cyclist fatalities in the U.S., despite accounting for only 27% of the population.
When comparing fatality rates (per commuter or per resident), the places with the worst bike accidents are clustered in the Southeastern U.S. Despite warmer weather, these states also report below-average rates of bike commuters, possibly the result of dangerous riding conditions. These states also have some of the worst bike crashes during a time period that affects many cyclists: daylight saving time switches.
With the rise of bike-share programs and an increased emphasis on more environmentally friendly modes of transportation, cycling is likely to continue growing in popularity, especially in major cities.
To identify which cities have the worst cycling crashes, our researchers here at CarInsurance.org analyzed fatality data from the National Highway Traffic Safety Administration’s Fatality Analysis Reporting System for the period 2014-2017, as well as population data from the U.S. Census Bureau’s American Community Survey.
They ranked cities by the number of bike fatalities per 100,000 bike commuters. Only cities with at least one cyclist fatality per year and at least 100,000 residents were included in the analysis. Consistent with the findings at the state level, 13 of the 20 most dangerous cities for cyclists are in Florida, California, or Texas.
Traffic deaths involving cyclists can increase car insurance rates for the entire area, even for drivers who haven’t been involved in those types of accidents, which may be confusing.
Even if you live in one of the most dangerous states for cyclists, you can still find the best rates for your area using our FREE online quote comparison tool. Enter your ZIP code to get started.
In addition to the ranking, we’ll cover how dangerous biking is in the city, the worst cities to cycle in, and the best countries to cycle in (this last part in the frequently asked questions section).
Now, keep reading to discover the full list of the most dangerous places in a bicycle in America.
Free Insurance Comparison
Compare Quotes From Top Companies and Save
![]() Secured with SHA-256 Encryption
Secured with SHA-256 Encryption
What are the top 20 most dangerous cities for cyclists?
Most Dangerous U.S. Cities for Cyclists #20 – Miami, Florida
- Annual bike fatalities per 100K commuters: 193
- Annual bike fatalities per 1M residents: 9.0
- Total bike fatalities (last 4 years): 16
- Share of fatalities where cyclist wore a helmet: 0%
- Number of bike commuters: 2,073
- Population: 443,007
Most Dangerous U.S. Cities for Cyclists #19 – Phoenix, Arizona
- Annual bike fatalities per 100K commuters: 201
- Annual bike fatalities per 1M residents: 6.5
- Total bike fatalities (last 4 years): 41
- Share of fatalities where cyclist wore a helmet: 12%
- Number of bike commuters: 5,090
- Population: 1,574,421
DID YOU KNOW?
Making smart choices behind the wheel can be both safer and cheaper. Learn driver safety tips and how to drive smarter and save money on gas here at CarInsurance.org.
Most Dangerous U.S. Cities for Cyclists #18 – Fort Lauderdale, Florida
- Annual bike fatalities per 100K commuters: 204
- Annual bike fatalities per 1M residents: 14.1
- Total bike fatalities (last 4 years): 10
- Share of fatalities where cyclist wore a helmet: 0%
- Number of bike commuters: 1,225
- Population: 177,175
Most Dangerous U.S. Cities for Cyclists #17 – Modesto, California
- Annual bike fatalities per 100K commuters: 239
- Annual bike fatalities per 1M residents: 4.8
- Total bike fatalities (last 4 years): 4
- Share of fatalities where cyclist wore a helmet: 0%
- Number of bike commuters: 419
- Population: 210,166
Most Dangerous U.S. Cities for Cyclists #16 – San Antonio, Texas
- Annual bike fatalities per 100K commuters: 243
- Annual bike fatalities per 1M residents: 2.2
- Total bike fatalities (last 4 years): 13
- Share of fatalities where cyclist wore a helmet: 8%
- Number of bike commuters: 1,340
- Population: 1,461,623
Most Dangerous U.S. Cities for Cyclists #15 – Oklahoma City, Oklahoma
- Annual bike fatalities per 100K commuters: 250
- Annual bike fatalities per 1M residents: 2.4
- Total bike fatalities (last 4 years): 6
- Share of fatalities where cyclist wore a helmet: 0%
- Number of bike commuters: 601
- Population: 629,191
TRENDING
Do you have to call the police or file a claim after an accident? Learn about this and other driving laws and tips here at CarInsurance.org.
Most Dangerous U.S. Cities for Cyclists #14 – Lafayette, Louisiana
- Annual bike fatalities per 100K commuters: 251
- Annual bike fatalities per 1M residents: 13.8
- Total bike fatalities (last 4 years): 7
- Share of fatalities where cyclist wore a helmet: 0%
- Number of bike commuters: 696
- Population: 126,476
Most Dangerous U.S. Cities for Cyclists #13 – Arlington, Texas
- Annual bike fatalities per 100K commuters: 262
- Annual bike fatalities per 1M residents: 2.6
- Total bike fatalities (last 4 years): 4
- Share of fatalities where cyclist wore a helmet: 0%
- Number of bike commuters: 382
- Population: 388,225
Most Dangerous U.S. Cities for Cyclists #12 – Charlotte, North Carolina
- Annual bike fatalities per 100K commuters: 267
- Annual bike fatalities per 1M residents: 2.7
- Total bike fatalities (last 4 years): 9
- Share of fatalities where cyclist wore a helmet: 11%
- Number of bike commuters: 843
- Population: 826,060
Most Dangerous U.S. Cities for Cyclists #11 – Bakersfield, California
- Annual bike fatalities per 100K commuters: 293
- Annual bike fatalities per 1M residents: 6.0
- Total bike fatalities (last 4 years): 9
- Share of fatalities where cyclist wore a helmet: 0%
- Number of bike commuters: 768
- Population: 372,680
Most Dangerous U.S. Cities for Cyclists #10 – Lakeland, Florida
- Annual bike fatalities per 100K commuters: 299
- Annual bike fatalities per 1M residents: 9.6
- Total bike fatalities (last 4 years): 4
- Share of fatalities where cyclist wore a helmet: 25%
- Number of bike commuters: 335
- Population: 104,165
Most Dangerous U.S. Cities for Cyclists #9 – Memphis, Tennessee
- Annual bike fatalities per 100K commuters: 309
- Annual bike fatalities per 1M residents: 2.7
- Total bike fatalities (last 4 years): 7
- Share of fatalities where cyclist wore a helmet: 0%
- Number of bike commuters: 567
- Population: 654,723
Most Dangerous U.S. Cities for Cyclists #8 – Baton Rouge, Louisiana
- Annual bike fatalities per 100K commuters: 319
- Annual bike fatalities per 1M residents: 8.8
- Total bike fatalities (last 4 years): 8
- Share of fatalities where cyclist wore a helmet: 0%
- Number of bike commuters: 627
- Population: 227,549
RELATED
Our researchers at CarInsurance.org recently published one of the internet’s most comprehensive insurance resource centers. It includes agent and broker reviews, company financial ratings, guides, regulatory information, and more.
Most Dangerous U.S. Cities for Cyclists #7 – Stockton, California
- Annual bike fatalities per 100K commuters: 327
- Annual bike fatalities per 1M residents: 7.4
- Total bike fatalities (last 4 years): 9
- Share of fatalities where cyclist wore a helmet: 0%
- Number of bike commuters: 688
- Population: 304,358
Most Dangerous U.S. Cities for Cyclists #6 – Chula Vista, California
- Annual bike fatalities per 100K commuters: 358
- Annual bike fatalities per 1M residents: 4.7
- Total bike fatalities (last 4 years): 5
- Share of fatalities where cyclist wore a helmet: 0%
- Number of bike commuters: 349
- Population: 264,101
Most Dangerous U.S. Cities for Cyclists #5 – Pompano Beach, Florida
- Annual bike fatalities per 100K commuters: 417
- Annual bike fatalities per 1M residents: 16.3
- Total bike fatalities (last 4 years): 7
- Share of fatalities where cyclist wore a helmet: 0%
- Number of bike commuters: 420
- Population: 107,542
Most Dangerous U.S. Cities for Cyclists #4 – Dayton, Ohio
- Annual bike fatalities per 100K commuters: 459
- Annual bike fatalities per 1M residents: 7.1
- Total bike fatalities (last 4 years): 4
- Share of fatalities where cyclist wore a helmet: 25%
- Number of bike commuters: 218
- Population: 140,939
Most Dangerous U.S. Cities for Cyclists #3 – San Bernardino, California
- Annual bike fatalities per 100K commuters: 578
- Annual bike fatalities per 1M residents: 8.1
- Total bike fatalities (last 4 years): 7
- Share of fatalities where cyclist wore a helmet: 14%
- Number of bike commuters: 303
- Population: 215,252
Most Dangerous U.S. Cities for Cyclists #2 – Abilene, Texas
- Annual bike fatalities per 100K commuters: 1,116
- Annual bike fatalities per 1M residents: 10.2
- Total bike fatalities (last 4 years): 5
- Share of fatalities where cyclist wore a helmet: 0%
- Number of bike commuters: 112
- Population: 122,762
Most Dangerous U.S. Cities for Cyclists #1 – Cape Coral, Florida
- Annual bike fatalities per 100K commuters: 1,333
- Annual bike fatalities per 1M residents: 5.8
- Total bike fatalities (last 4 years): 4
- Share of fatalities where cyclist wore a helmet: 0%
- Number of bike commuters: 75
- Population: 173,679
Full Results for All U.S. Cities
Take a look at the table below to see bicycle accident statistics by states’ major cities.
| City & State | Annual Bike Fatalities (per 100K Commuters) | Annual Bike Fatalities (per 1M Residents) | Total Bike Fatalities (Last 4 Years) | Share of fatalities where cyclist wore a helmet | Number of Bike Commuters | City Population | Rank |
|---|---|---|---|---|---|---|---|
| Cape Coral, Florida | 1333.3 | 6.0 | 4 | 0% | 75 | 173,679 | 1 |
| Abilene, Texas | 1116.1 | 10.0 | 5 | 0% | 112 | 122,762 | 2 |
| San Bernardino, California | 577.6 | 8.0 | 7 | 14% | 303 | 215,252 | 3 |
| Dayton, Ohio | 458.7 | 7.0 | 4 | 25% | 218 | 140,939 | 4 |
| Pompano Beach, Florida | 416.7 | 16.0 | 7 | 0% | 420 | 107,542 | 5 |
| Chula Vista, California | 358.2 | 5.0 | 5 | 0% | 349 | 264,101 | 6 |
| Stockton, California | 327 | 7.0 | 9 | 0% | 688 | 304,358 | 7 |
| Baton Rouge, Louisiana | 319 | 9.0 | 8 | 0% | 627 | 227,549 | 8 |
| Memphis, Tennessee | 308.6 | 3.0 | 7 | 0% | 567 | 654,723 | 9 |
| Lakeland, Florida | 298.5 | 10.0 | 4 | 25% | 335 | 104,165 | 10 |
| Bakersfield, California | 293 | 6.0 | 9 | 0% | 768 | 372,680 | 11 |
| Charlotte, North Carolina | 266.9 | 3.0 | 9 | 11% | 843 | 826,060 | 12 |
| Arlington, Texas | 261.8 | 3.0 | 4 | 0% | 382 | 388,225 | 13 |
| Lafayette, Louisiana | 251.4 | 14.0 | 7 | 0% | 696 | 126,476 | 14 |
| Oklahoma City, Oklahoma | 249.6 | 2.0 | 6 | 0% | 601 | 629,191 | 15 |
| San Antonio, Texas | 242.5 | 2.0 | 13 | 8% | 1340 | 1,461,623 | 16 |
| Modesto, California | 238.7 | 5.0 | 4 | 0% | 419 | 210,166 | 17 |
| Fort Lauderdale, Florida | 204.1 | 14.0 | 10 | 0% | 1225 | 177,175 | 18 |
| Phoenix, Arizona | 201.4 | 7.0 | 41 | 12% | 5090 | 1,574,421 | 19 |
| Miami, Florida | 193 | 9.0 | 16 | 0% | 2073 | 443,007 | 20 |
| Spokane, Washington | 189.1 | 6.0 | 5 | 40% | 661 | 212,982 | 21 |
| Jersey City, New Jersey | 187.3 | 4.0 | 4 | 0% | 534 | 265,932 | 22 |
| Wilmington, North Carolina | 186.6 | 11.0 | 5 | 0% | 670 | 115,261 | 23 |
| Jacksonville, Florida | 182.7 | 4.0 | 15 | 7% | 2052 | 867,313 | 24 |
| Wichita, Kansas | 181.2 | 3.0 | 4 | 0% | 552 | 389,054 | 25 |
| Las Vegas, Nevada | 179.4 | 3.0 | 8 | 13% | 1115 | 621,662 | 26 |
| Santa Ana, California | 177.1 | 7.0 | 10 | 0% | 1412 | 334,493 | 27 |
| Riverside, California | 176.8 | 5.0 | 7 | 29% | 990 | 321,570 | 28 |
| Garden Grove, California | 173.9 | 6.0 | 4 | 0% | 575 | 174,812 | 29 |
| Saint Louis, Missouri | 166.9 | 6.0 | 8 | 13% | 1198 | 314,867 | 30 |
| Clearwater, Florida | 163.8 | 11.0 | 5 | 0% | 763 | 112,794 | 31 |
| Springfield, Missouri | 159.5 | 6.0 | 4 | 0% | 627 | 165,785 | 32 |
| Reno, Nevada | 158.4 | 6.0 | 6 | 17% | 947 | 239,732 | 33 |
| Tampa, Florida | 153.6 | 10.0 | 14 | 7% | 2278 | 368,087 | 34 |
| Louisville, Kentucky | 149.8 | 3.0 | 7 | 14% | 1168 | 615,478 | 35 |
| Gilbert, Arizona | 148.4 | 4.0 | 4 | 25% | 674 | 232,176 | 36 |
| Virginia Beach, Virginia | 140.4 | 4.0 | 8 | 13% | 1425 | 450,057 | 37 |
| Mesa, Arizona | 138.9 | 6.0 | 11 | 18% | 1980 | 479,317 | 38 |
| Fort Worth, Texas | 128.9 | 1.0 | 4 | 0% | 776 | 835,129 | 39 |
| Indianapolis, Indiana | 123.9 | 3.0 | 10 | 0% | 2018 | 853,431 | 40 |
| Grand Rapids, Michigan | 120 | 6.0 | 5 | 0% | 1042 | 195,355 | 41 |
| Orlando, Florida | 117.4 | 4.0 | 4 | 0% | 852 | 269,414 | 42 |
| Sacramento, California | 116 | 10.0 | 20 | 5% | 4310 | 489,650 | 43 |
| Detroit, Michigan | 113.1 | 3.0 | 8 | 0% | 1768 | 679,865 | 44 |
| Houston, Texas | 110.1 | 3.0 | 24 | 4% | 5451 | 2,267,336 | 45 |
| Durham, North Carolina | 109.1 | 4.0 | 4 | 0% | 917 | 257,232 | 46 |
| Anaheim, California | 99.8 | 3.0 | 4 | 0% | 1002 | 349,007 | 47 |
| Huntington Beach, California | 97.5 | 7.0 | 6 | 0% | 1539 | 200,415 | 48 |
| Colorado Springs, Colorado | 95.3 | 3.0 | 5 | 40% | 1311 | 450,000 | 49 |
| Savannah, Georgia | 92.7 | 9.0 | 5 | 40% | 1349 | 145,094 | 50 |
| Saint Petersburg, Florida | 92.1 | 6.0 | 6 | 0% | 1628 | 256,031 | 51 |
| Buffalo, New York | 83.5 | 4.0 | 4 | 0% | 1197 | 259,574 | 52 |
| Fresno, California | 82.1 | 3.0 | 6 | 17% | 1826 | 519,037 | 53 |
| San Jose, California | 77.3 | 3.0 | 14 | 0% | 4527 | 1,023,031 | 54 |
| Columbus, Ohio | 73.9 | 3.0 | 9 | 11% | 3043 | 852,144 | 55 |
| Sunnyvale, California | 71.1 | 7.0 | 4 | 0% | 1407 | 151,565 | 56 |
| Los Angeles, California | 69.3 | 4.0 | 58 | 12% | 20912 | 3,949,776 | 57 |
| New Orleans, Louisiana | 66.9 | 10.0 | 15 | 7% | 5604 | 388,182 | 58 |
| Albuquerque, New Mexico | 61.4 | 4.0 | 9 | 0% | 3663 | 556,718 | 59 |
| Tucson, Arizona | 51.3 | 7.0 | 14 | 14% | 6826 | 530,905 | 60 |
| Charleston, South Carolina | 48.9 | 8.0 | 4 | 0% | 2044 | 131,204 | 61 |
| Gainesville, Florida | 44.3 | 10.0 | 5 | 20% | 2821 | 129,394 | 62 |
| New York, New York | 38.8 | 2.0 | 74 | 12% | 47701 | 8,560,072 | 63 |
| Ann Arbor, Michigan | 38 | 8.0 | 4 | 0% | 2635 | 119,303 | 64 |
| Milwaukee, Wisconsin | 37.5 | 2.0 | 4 | 0% | 2664 | 599,086 | 65 |
| Austin, Texas | 33.9 | 2.0 | 9 | 0% | 6636 | 916,906 | 66 |
| Denver, Colorado | 30.9 | 4.0 | 10 | 10% | 8083 | 678,467 | 67 |
| San Diego, California | 28.5 | 1.0 | 8 | 25% | 7011 | 1,390,966 | 68 |
| Philadelphia, Pennsylvania | 27.5 | 2.0 | 15 | 0% | 13641 | 1,569,657 | 69 |
| Chicago, Illinois | 27.4 | 2.0 | 24 | 4% | 21900 | 2,722,586 | 70 |
| Boston, Massachusetts | 20 | 2.0 | 6 | 0% | 7500 | 669,158 | 71 |
| Oakland, California | 16.7 | 2.0 | 4 | 0% | 5994 | 417,442 | 72 |
| Minneapolis, Minnesota | 15.9 | 4.0 | 6 | 33% | 9433 | 411,452 | 73 |
| Seattle, Washington | 14.2 | 3.0 | 8 | 25% | 14096 | 688,245 | 74 |
| San Francisco, California | 14.2 | 3.0 | 11 | 46% | 19317 | 864,263 | 75 |
| Portland, Oregon | 10.3 | 4.0 | 9 | 33% | 21781 | 630,331 | 76 |
| Washington, District Of Columbia | 7.7 | 2.0 | 5 | 20% | 16314 | 672,391 | 77 |
Analyzing the Top 20 Most Dangerous Cities for Cyclists Across the U.S.
To truly grasp the safety landscape for cyclists, it’s essential to look beyond individual states and identify where the highest risks are. This includes considering the Top 20 most dangerous cities in the US. Here we delve into the top 20 deadliest cities in America for cyclists, focusing on specific states known for their dangerous cycling conditions. top 20 most dangerous cities in the us
State-by-State Breakdown of Dangerous Cities
Arizona
Cycling in Arizona can be perilous, with Tucson leading the top 20 most dangerous cities in Arizona. The state’s high fatality rates are a significant concern for cyclists.
California
In California, cities like Los Angeles and San Bernardino are among the top 20 most dangerous cities in California. The state’s bustling urban centers contribute to the elevated risks.
Florida
Florida consistently reports high cyclist fatalities, with cities like Miami and Cape Coral making the top 20 most dangerous cities in Florida list.
Illinois
Cycling in Illinois can be dangerous, especially in Chicago, which is part of the top 20 most dangerous cities in Illinois. Urban congestion and traffic contribute to these risks.
Indiana
Indiana has its share of risky areas for cyclists, with Indianapolis and Fort Wayne being notable mentions in the top 20 most dangerous cities in Indiana.
Massachusetts
Boston and Springfield are key cities in the top 20 most dangerous cities in Massachusetts. Cyclists here face challenges from heavy traffic and dense urban layouts.
Mississippi
Mississippi’s cities, including Jackson and Gulfport, feature prominently in the top 20 most dangerous cities in Mississippi for cyclists.
North Carolina
Charlotte and Raleigh are part of the top 20 most dangerous cities in NC, reflecting the state’s cycling safety issues.
Oklahoma
In Oklahoma, Oklahoma City and Tulsa are among the top 20 most dangerous cities in Oklahoma. These urban areas report higher cyclist fatalities.
South Carolina
South Carolina’s dangerous cities for cyclists include Charleston and Columbia, making the top 20 most dangerous cities in South Carolina list.
Texas
Texas has several high-risk cities for cyclists, with Houston, San Antonio, and Dallas among the top 20 most dangerous cities in Texas. The state’s large metropolitan areas contribute to the heightened danger.
Key Takeaways for Cyclists
- Urban Areas: Most of the dangerous cities are large urban centers with heavy traffic.
- Safety Measures: Cyclists in these areas should be particularly vigilant and adhere to safety practices, such as wearing helmets and using bike lanes.
- Policy Implications: There is a need for improved infrastructure and safety measures in these cities to protect cyclists.
By understanding the top 20 most dangerous cities in America, cyclists can better prepare and advocate for safer riding conditions. Cycling in the top 20 most dangerous cities in the United States presents significant risks, with urban areas showing particularly high fatality rates.
Free Insurance Comparison
Compare Quotes From Top Companies and Save
![]() Secured with SHA-256 Encryption
Secured with SHA-256 Encryption
Top 10 Top 10 Deadliest Cities in America
Cycling in urban areas can be hazardous, and our analysis reveals the top 10 most dangerous cities in America for cyclists. Among the top 10 dangerous cities in America, Tucson, Arizona, stands out with 1.26 fatalities per 100,000 people. The top 10 dangerous cities in the US also include Miami, Phoenix, and Fort Lauderdale. The top 10 deadliest cities in the US reflect a broader trend of increased cyclist fatalities, especially in states like California, Florida, and Texas. Understanding the risks in these US top 10 dangerous cities is crucial for improving safety measures and reducing accidents in the top 10 dangerous US cities.
Cycling in the top 10 dangerous cities in the US poses significant risks, with a high number of fatalities per capita. Tucson, Arizona, ranks at the top, making it one of the top 10 deadliest cities in US for cyclists. Other cities that make the list include Miami, Phoenix, and Fort Lauderdale. Understanding the dangers in these areas is crucial for improving safety measures and protecting cyclists.
Comparing Cycling Fatalities by Country
When examining cycling fatalities by country, there are significant differences in safety and infrastructure. Cycling fatality rates by country highlight these discrepancies, with some nations achieving notably lower rates due to robust cycling cultures and infrastructure.
For example, the Netherlands and Denmark, known for their extensive cycling networks, have some of the lowest cycling fatality rates by country. In contrast, countries with less developed cycling infrastructure, like the United States, report higher cyclist deaths per year.
Despite some perceptions that cyclists are the worst in terms of traffic behavior, the data consistently shows that improved infrastructure and safety measures can drastically reduce fatalities and make cycling a safer mode of transportation.
Bicycle Use Across the Globe
Several countries lead in bicycle use, reflecting a cultural and infrastructural embrace of cycling. The Netherlands stands out as the country with the most bikes per capita, where cycling is deeply integrated into daily life and urban planning. Other countries with the highest bicycle use include Denmark, Germany, and Japan, where extensive networks of bike lanes and supportive policies encourage widespread cycling as a sustainable mode of transport. These nations prioritize cycling safety and infrastructure, contributing to their high rates of bicycle use among residents.
Free Insurance Comparison
Compare Quotes From Top Companies and Save
![]() Secured with SHA-256 Encryption
Secured with SHA-256 Encryption
Which is the most dangerous place for a bicyclist?
Just how dangerous is biking in the city? In our study, our experts found that Cape Coral is the most dangerous place for bicyclists with 1,333 bicyclist deaths per 100,000 residents. One number that jumps out from Cape Coral is the percentage of bicyclists that wear helmets: 0. That could contribute to higher bicyclist deaths, which makes Cape Coral known for the most dangerous roads for cyclists.
Which US city has the most cyclists per capita?
Portland, Oregon, has the highest percentage of cyclists per capita, with 6.3% of commuters biking to work. However, it is also among the top 10 most dangerous cities in the US per capita.
Where do most bicycle fatalities occur?
What is the most dangerous place for a bicyclist on the road? Most bicycle fatalities occur in urban areas, with 75% of all bicycle fatalities occurring in urban areas compared to 25% occurring in rural areas. Therefore, urban areas are the most dangerous places for bicyclists to be on the road.
Free Insurance Comparison
Compare Quotes From Top Companies and Save
![]() Secured with SHA-256 Encryption
Secured with SHA-256 Encryption
How many cyclists die each year in the US?
According to the National Highway Traffic Safety Administration, around 850 total cyclists died in traffic accidents in 2018. This represented an increase of 6% compared to 2017.
How dangerous is cycling?
A National Travel Survey showed that, on average, there was one bicyclist fatality per nine million bike rides and that the risk of any injury was just 5% per 1,000 hours of cycling.
What is the bike capital of the world?
The Netherlands is known as the bike capital of the world with 20 million bicycles per population of 17 million people.
Free Insurance Comparison
Compare Quotes From Top Companies and Save
![]() Secured with SHA-256 Encryption
Secured with SHA-256 Encryption
Which city is known as the City of Cycles?
Pune, a city in India, was known as the City of Cycles for a number of years before vehicles and motorcycles slowly took over the city. Despite government initiatives to promote biking, Pune remains one of the highest cities in India for vehicles per capita and is considered the most dangerous city per capita.
Which country is the most bicycle-friendly?
Denmark is seen by some as the country that is the most bicycle-friendly, making it one of the safest cycling cities. It has huge networks of bike trails that go where even cars can’t and allow tourists and locals alike to explore the country while gaining exercise at the same time.
What do these most dangerous cycling cities have in common?
One disturbing fact about the data regarding pedestrian deaths and cyclist fatalities is that they disproportionately impact minority groups. According to the Dangerous by Design study, Hispanic and African American drivers, on average, drive fewer miles and walk more than other driver groups. Walking is a critical mode of transportation for these groups; nearly 20 percent of African-American households and 14 percent of Latino households live without a car. African Americans walk on an average of 26 percent more trips than white people, and Hispanics walk on an average of 45 percent more trips than white folks. Whites made only 9.4% of trips on foot in 2008, African Americans made 11% of trips on foot, Hispanics made 13.1% of trips on foot. (Source) These groups also experience far more pedestrian injuries and fatalities. Therefore the answer to “How dangerous is cycling?” can depend on demographics.
Free Insurance Comparison
Compare Quotes From Top Companies and Save
![]() Secured with SHA-256 Encryption
Secured with SHA-256 Encryption
Methodology: How were the 20 most dangerous cities for cycling determined?
Cyclist fatality statistics were obtained from the National Highway Traffic Safety Administration’s Fatality Analysis Reporting System for the period 2014-2017.
Population statistics, including total city population and age distribution, as well as cyclist commuting rates, were obtained from the U.S. Census Bureau’s American Community Survey.
The cities in this analysis were ranked according to the cyclist’s fatality rate.
Cyclist fatality rates were calculated as the average number of cyclist fatalities in the city for the period 2014-2017 per 100,000 estimated cycling commuters in 2017.
All cities included in the final list had a population of at least 100,000, as well as at least one cyclist death per year.
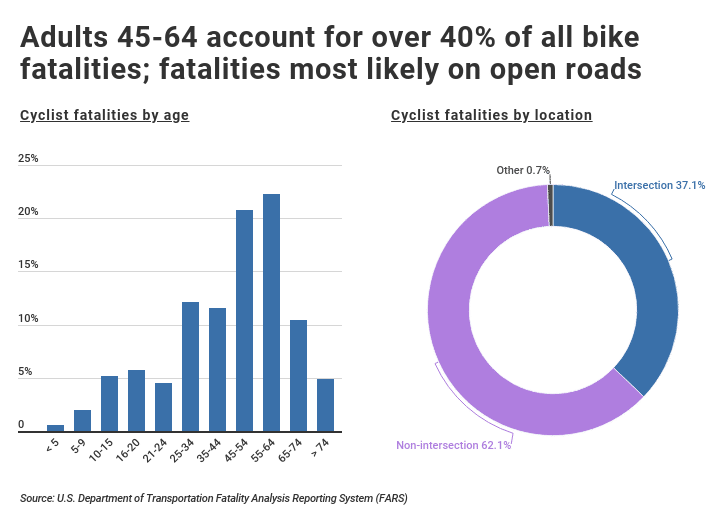
A closer look at the data yields additional insights into the worst bike accidents. For example, adults over 45 are more likely to be involved in a fatal cycling accident than younger people. More specifically, nearly 60% of cycling fatalities between 2014-2017 involved victims over the age of 45.
Furthermore, more than 60% of fatal bike accidents occur outside of intersections on open roads. In 38% of fatal bike accidents, the motorist was at fault. By contrast, the cyclist was deemed to be at fault only 31% of the time. In the remaining cases, the fault was unknown or was not reported.
Despite the rising rate of fatal bicycle accidents, there are many things that can be done at the individual level to improve cycling safety. According to NHTSA, bicycle helmets can reduce the risk of head injury by 85%.
Interestingly, only about 16% of cyclists involved in fatal accidents were known to be wearing helmets. For cyclists, wearing a helmet and adhering to traffic rules (such as riding in the same direction as motor vehicles or in existing bike lanes) can reduce the risk of collision or bicycle-related injuries. In addition, reducing distractions such as texting can make cycling a safer mode of transportation. Bicycle safety is always a huge priority.
Before making any final decisions about your insurance company, it is important to learn as much as you can about your local insurance providers, and the coverage they offer. Call your local insurance agent to clear up any questions that you might have. Questions to consider asking include, “What is the best coverage plan for me/my family/my situation?” “What are the minimum coverage requirements in my state and what form of coverage do you recommend?” “Do you guys offer any bundle discounts if I take out both my auto insurance and home insurance with you?” and “What is the average rate of insurance quotes you guys offer?”
Before making any big insurance decisions, use our free tool to compare insurance quotes near you. It’s simple, just plug in your zip code and we’ll do the rest!
Cycling deaths can cause car insurance rates to rise, even if you weren’t involved in the accident. Get the best car insurance rate by entering your ZIP code into our FREE online quote generator.

Frequently Asked Questions
What are the worst cities in America for cyclists?
The worst cities in America for cyclists include Tucson, Arizona; Miami, Florida; and Cape Coral, Florida. These cities have the highest rates of cyclist fatalities per capita.
What is the most dangerous city in Ohio for cyclists?
Dayton is considered the most dangerous city in Ohio for cyclists, with a high number of fatalities per 100,000 residents.
What is the most dangerous city in Oklahoma for cyclists?
Oklahoma City is the most dangerous city in Oklahoma for cyclists, experiencing a significant number of bike-related fatalities.
What state has the most bicycle fatalities?
Florida has the most bicycle fatalities, with cities like Miami and Cape Coral contributing significantly to the high numbers.
What’s the most dangerous place in California for cyclists?
San Bernardino is one of the most dangerous places in California for cyclists, with a high rate of fatal accidents.
Where are some of the most dangerous places in St. Petersburg for cyclists?
In St. Petersburg, Florida, major thoroughfares and intersections are particularly dangerous for cyclists, especially during peak traffic hours.
Which city has the most bicycles per capita?
Portland, Oregon, has the most bicycles per capita in the U.S., with 6.3% of commuters using bicycles to get to work.
Which city in the US is the most dangerous for cyclists?
Cape Coral, Florida, is the most dangerous city in the U.S. for cyclists, with the highest rate of fatalities per 100,000 residents.
What is the most dangerous place for a bicyclist?
Urban areas are the most dangerous places for bicyclists, with 75% of all bicycle fatalities occurring in these regions compared to 25% in rural areas.
Can cyclists ride on the sidewalk?
Get a FREE Quote in Minutes
Insurance rates change constantly — we help you stay ahead by making it easy to compare top options and save.
![]() Secured with SHA-256 Encryption
Secured with SHA-256 Encryption